
Under intermittent hydrogen supply, when can clean ammonia remain cost-competitive with delivered benchmark ammonia?
Problem statement: This Product A note maps the structural parity boundary for clean ammonia when hydrogen production is variable but ammonia synthesis demand is continuous. It isolates threshold conditions for hydrogen cost, policy-credit support, and temporal mismatch penalty before operational persistence stress-testing.
Most techno-economic results are conditionally true and operationally unattainable without constraint validation.
Cheap electricity without utilization is a trap, not an advantage.
Reading mode: Product A is a structural parity screen. Product B (the companion fragility note) tests whether this region survives temporal mismatch and utilization degradation.
This note uses source-validated benchmark and policy-traceability inputs in the local repository, with deterministic threshold logic for decision screening.
DG-PFF Application Marker
- Parity condition:
Net LCOA_clean <= benchmark ammonia cost.- Viability region: Parameterized by delivered H2 cost, policy-credit support, and temporal mismatch penalty.
- Fragility link: Threshold movement is tracked against temporal mismatch penalty and effective synthesis utilization.
- Parity persistence rule: Parity without persistence is not viability.
Decision Summary (Threshold Output)
- GO:
H2 <= ~$2.2/kg, temporal penalty<= ~$20/tonne, support>= ~$150/tonne. - CONDITIONAL: case remains on or below
H2_cost_threshold = (Benchmark + Policy_Credit - 310 - Temporal_Penalty) / 176. - NO-GO: any case above threshold, temporal penalty
> ~$50/tonne, or support<= ~$100/tonnewith temporal penalty> ~$40/tonneenters Temporal Decoupling Failure Regime.
Clean ammonia viability is governed by temporal alignment between hydrogen production and continuous synthesis demand. Below ~65% electrolyzer capacity factor, temporal mismatch forces either storage scaling or synthesis underutilization, both of which introduce compounding penalties. These penalties eliminate the apparent advantage of low-cost electricity and contract the viable region to a narrow band of high-utilization, partially firmed power conditions. This defines the Temporal Decoupling Failure Regime.
Feasibility Boundary
| Boundary | Canonical threshold | Mechanism | Decision implication |
|---|---|---|---|
Electrolyzer utilization floor (CF_eff) |
< ~65% in low-cost/intermittent-power configurations |
Entry into Temporal Decoupling Failure Regime; temporal penalties and fixed-cost dilution dominate | No-Go |
| Delivered electricity ceiling | > ~$55/MWh in high-utilization configurations |
Variable-cost dominance removes parity headroom | Rework or No-Go unless structure changes |
| H2 storage continuity floor | < ~12 h when CF < ~0.60 with continuous synthesis |
Buffer insufficiency drives continuity failure and mismatch penalties | Rework |
Below ~65% electrolyzer capacity factor, ammonia cost parity cannot be achieved regardless of electricity price or incremental storage.
Product A: Decision Brief (3-Minute Screen)
The following configurations fail this Product A screen and should be treated as immediate no-go unless structure changes:
- Hydrogen cost above model-implied threshold. If delivered H2 exceeds
H2_cost_threshold = (Benchmark_Ammonia + Policy_Credit - 310 - Temporal_Penalty) / 176, parity is not observed. Under benchmark~$650/tonne, support<=$100/tonne, and temporal penalty~$50/tonne, that threshold tightens to approximately$2.22/kg. - High temporal penalty under low support. Under support
<=$100/tonne, temporal penalties above~$40/tonnecollapse large portions of the parity region; above~$50/tonne, parity fails across the default support range in this setup. - No credible near-continuous synthesis plan. If effective synthesis utilization cannot be held near the screening boundary, the configuration is structurally non-viable for capital decisions.
Structured Go/No-Go output
| Status | Trigger condition | Decision handling |
|---|---|---|
| Go | H2 <= ~$2.2/kg, temporal penalty <= ~$20/tonne, and policy support >= ~$150/tonne at ~$650/tonne benchmark |
Proceed to Product B fragility testing and project-specific diligence. |
| Conditional Go | Case does not meet Go bounds, but still satisfies H2 <= (Benchmark_Ammonia + Policy_Credit - 310 - Temporal_Penalty) / 176 under benchmark ~$650/tonne, support ~$100-$150/tonne, and temporal penalty ~$20-$50/tonne |
Proceed only with explicit temporal-risk controls and storage/utilization validation. |
| No-Go | H2 > (Benchmark_Ammonia + Policy_Credit - 310 - Temporal_Penalty) / 176; or temporal penalty > ~$50/tonne; or any case with support <= ~$100/tonne and temporal penalty > ~$40/tonne |
Do not proceed without redesign of power, storage, or contract structure. |
Viability Thresholds (Product A)
| Boundary | Hard threshold (screening) | Decision implication |
|---|---|---|
| Delivered hydrogen cost | Must satisfy H2 <= (Benchmark + Policy_Credit - 310 - Temporal_Penalty)/176 |
Above boundary invalidates parity. |
| Temporal mismatch penalty | > ~$40/tonne under <= ~$100/tonne support is collapse-prone; > ~$50/tonne is No-Go |
Penalty load can eliminate parity even when H2 appears competitive. |
| Policy dependence | Support-tier downgrade from ~$150 to ~$100/tonne tightens H2 ceiling materially |
Tier dependence is a binding constraint, not a scenario preference. |
| Effective utilization linkage | Non-H2 block scales as 310 * (0.90 / CF_eff) |
Lower CF shifts cases above parity even at favorable H2 price points. |
DG-PFF Execution Trace
- Parity condition defined against delivered benchmark ammonia cost (illustrative import-dependent delivered basis used in this release).
- Viability region mapped as H2-cost and temporal-penalty threshold combinations under stated support assumptions.
- Fragility represented by threshold movement as temporal penalties increase.
- Collapse thresholds identified where parity fails despite favorable assumptions in other variables.
- Go/No-Go handling produced with explicit trigger ranges for screening decisions.
Constraint Triangle (No-Free-Lunch Condition)
- Cheap power usually implies lower temporal alignment, which increases curtailment and storage burden.
- High utilization usually implies firmer power procurement, which increases delivered power cost.
- Low storage provision reduces buffer cost but increases synthesis disruption and mismatch penalties.
There is no operating regime where low-cost electricity, high utilization, minimal storage, and continuous synthesis are simultaneously achievable.
Viable Operating Region After Temporal Constraints
- Effective synthesis utilization maintained near or above
~85%; below~60-65%, collapse is structural, not incremental. - Partially firmed power procurement that keeps delivered electricity near or below
~$55/MWhwhile preserving continuity. - Storage and dispatch architecture sized beyond short-duration buffering (
>= ~12 hwhenCF < ~0.60) to limit temporal-penalty escalation. - Hydrogen-only parity regions assume synchronous utilization; ammonia synthesis introduces temporal constraints that collapse these regions.
Ammonia viability is not an extension of hydrogen economics; it is a constrained subset defined by temporal alignment.
Core decision question
At what hydrogen-cost and temporal-penalty combination does clean ammonia lose cost parity against the delivered benchmark under explicit policy-support assumptions?
Temporal Decoupling Failure Regime (Named Failure Mode)
Temporal Decoupling Failure (Utilization Collapse Regime): the project enters failure when temporal mismatch and utilization dilution push Net LCOA_clean above benchmark despite favorable steady-state price assumptions.
Capital Lock-In Risk
- Electrolyzer assets are dispatch-flexible.
- Haber-Bosch synthesis assets are capital-rigid and utilization-sensitive.
- Coupling them transfers hydrogen intermittency into fixed-cost dilution at the synthesis block.
- Temporal mismatch converts a flexible upstream asset into a rigid capital utilization problem downstream.
Intermittency is not an operating issue. It is a capital efficiency problem.
Decision owner and timing
- Decision owner: Project developer, investment committee, lender screening team.
- Decision timing: Prior to procurement lock, financing term-sheet finalization, or FID gate.
Confidence / robustness tag
Confidence: Medium (deterministic threshold sweep with source-validated benchmark/policy inputs and calibrated decomposition structure; scenario-specific reruns remain required for alternate regional bases), benchmark run dated April 10, 2026.
Structural Claim
Clean-ammonia parity is structurally conditional on the joint boundary of delivered H2 cost, temporal mismatch penalty, and realized policy support. The feasible region narrows rapidly once low-support and moderate-penalty conditions coincide.
Constraint Statement (DG-PFF)
If the modeled threshold condition H2 <= (Benchmark_Ammonia + Policy_Credit - 310 - Temporal_Penalty) / 176 is not met, the case is non-viable for decision-grade screening under this Product A specification.
Product B: Technical Note (Audit Trail)
Parity model form
This note decomposes clean ammonia cost using current source-validated baseline inputs:
- Benchmark ammonia basis used in illustrative thresholds:
~$650/tonneon an import-dependent delivered basis (not US Gulf/Middle East normalized spot basis). Policy_Creditrepresents realized support value (for example, 45V pass-through equivalent, LCFS-linked credit value, or bilateral contract premium).- Baseline clean ammonia cost anchor:
~$750/tonne. - Hydrogen contribution at defaults:
176 kg-H2/tonne * $2.50/kg = $440/tonne. - Reference non-hydrogen cost block at
CF_eff ~= 0.90:~$310/tonne; if utilization falls, this block scales upward as310 * (0.90 / CF_eff)(expanded in Product B).
Parity equation:
Net LCOA_clean = 310 + 176 * H2_cost + Temporal_Penalty - Policy_Credit

Parity when:
Net LCOA_clean <= Benchmark_Ammonia
Where Policy_Credit is the realized support term for the specific mechanism used in the case definition.
Expanded utilization-linked form for cross-note consistency: Net LCOA_clean ~= 176 * H2_cost + 310 * (0.90 / CF_eff) + Temporal_Penalty - Policy_Credit.
Equivalent hydrogen threshold:
H2_cost_threshold = (Benchmark_Ammonia + Policy_Credit - 310 - Temporal_Penalty) / 176
Temporal Penalty Stack (Explicit)
Temporal_Penalty_total
  ~= P_storage_capex
   + P_storage_losses
   + P_curtailment_or_replacement
   + P_turndown_inefficiency
   + P_restart_and_cycling
- Storage CAPEX
- Storage losses
- Curtailment
- Turndown inefficiency
- Cycling penalties
These penalties compound and scale nonlinearly with intermittency.
- Screening collapse signal: when
Temporal_Penalty_totalrises above~$40/tonneunder<= ~$100/tonnesupport, the feasible parity window shrinks rapidly. - Hard No-Go signal: when
Temporal_Penalty_totalexceeds~$50/tonnein the baseline support regime, parity fails across most central H2-cost cases. - Data anchor: decomposition components are traceable in
ammonia_temporal_penalty_decomposition_template.csv.
Illustrative threshold points (current assumptions)
- At benchmark
~$650/tonne, policy credit~$100/tonne, temporal penalty~$0/tonne:H2_cost_threshold ~= $2.50/kg
- At benchmark
~$650/tonne, policy credit~$100/tonne, temporal penalty~$50/tonne:H2_cost_threshold ~= $2.22/kg
- At benchmark
~$650/tonne, policy credit~$0/tonne, temporal penalty~$0/tonne:H2_cost_threshold ~= $1.93/kg
Interpretation: Without policy support or temporal control, parity requires hydrogen costs materially below the central screening assumptions.
Ammonia economics are not hydrogen economics. They are synchronization economics.
Figure 1 - Primary Parity Map
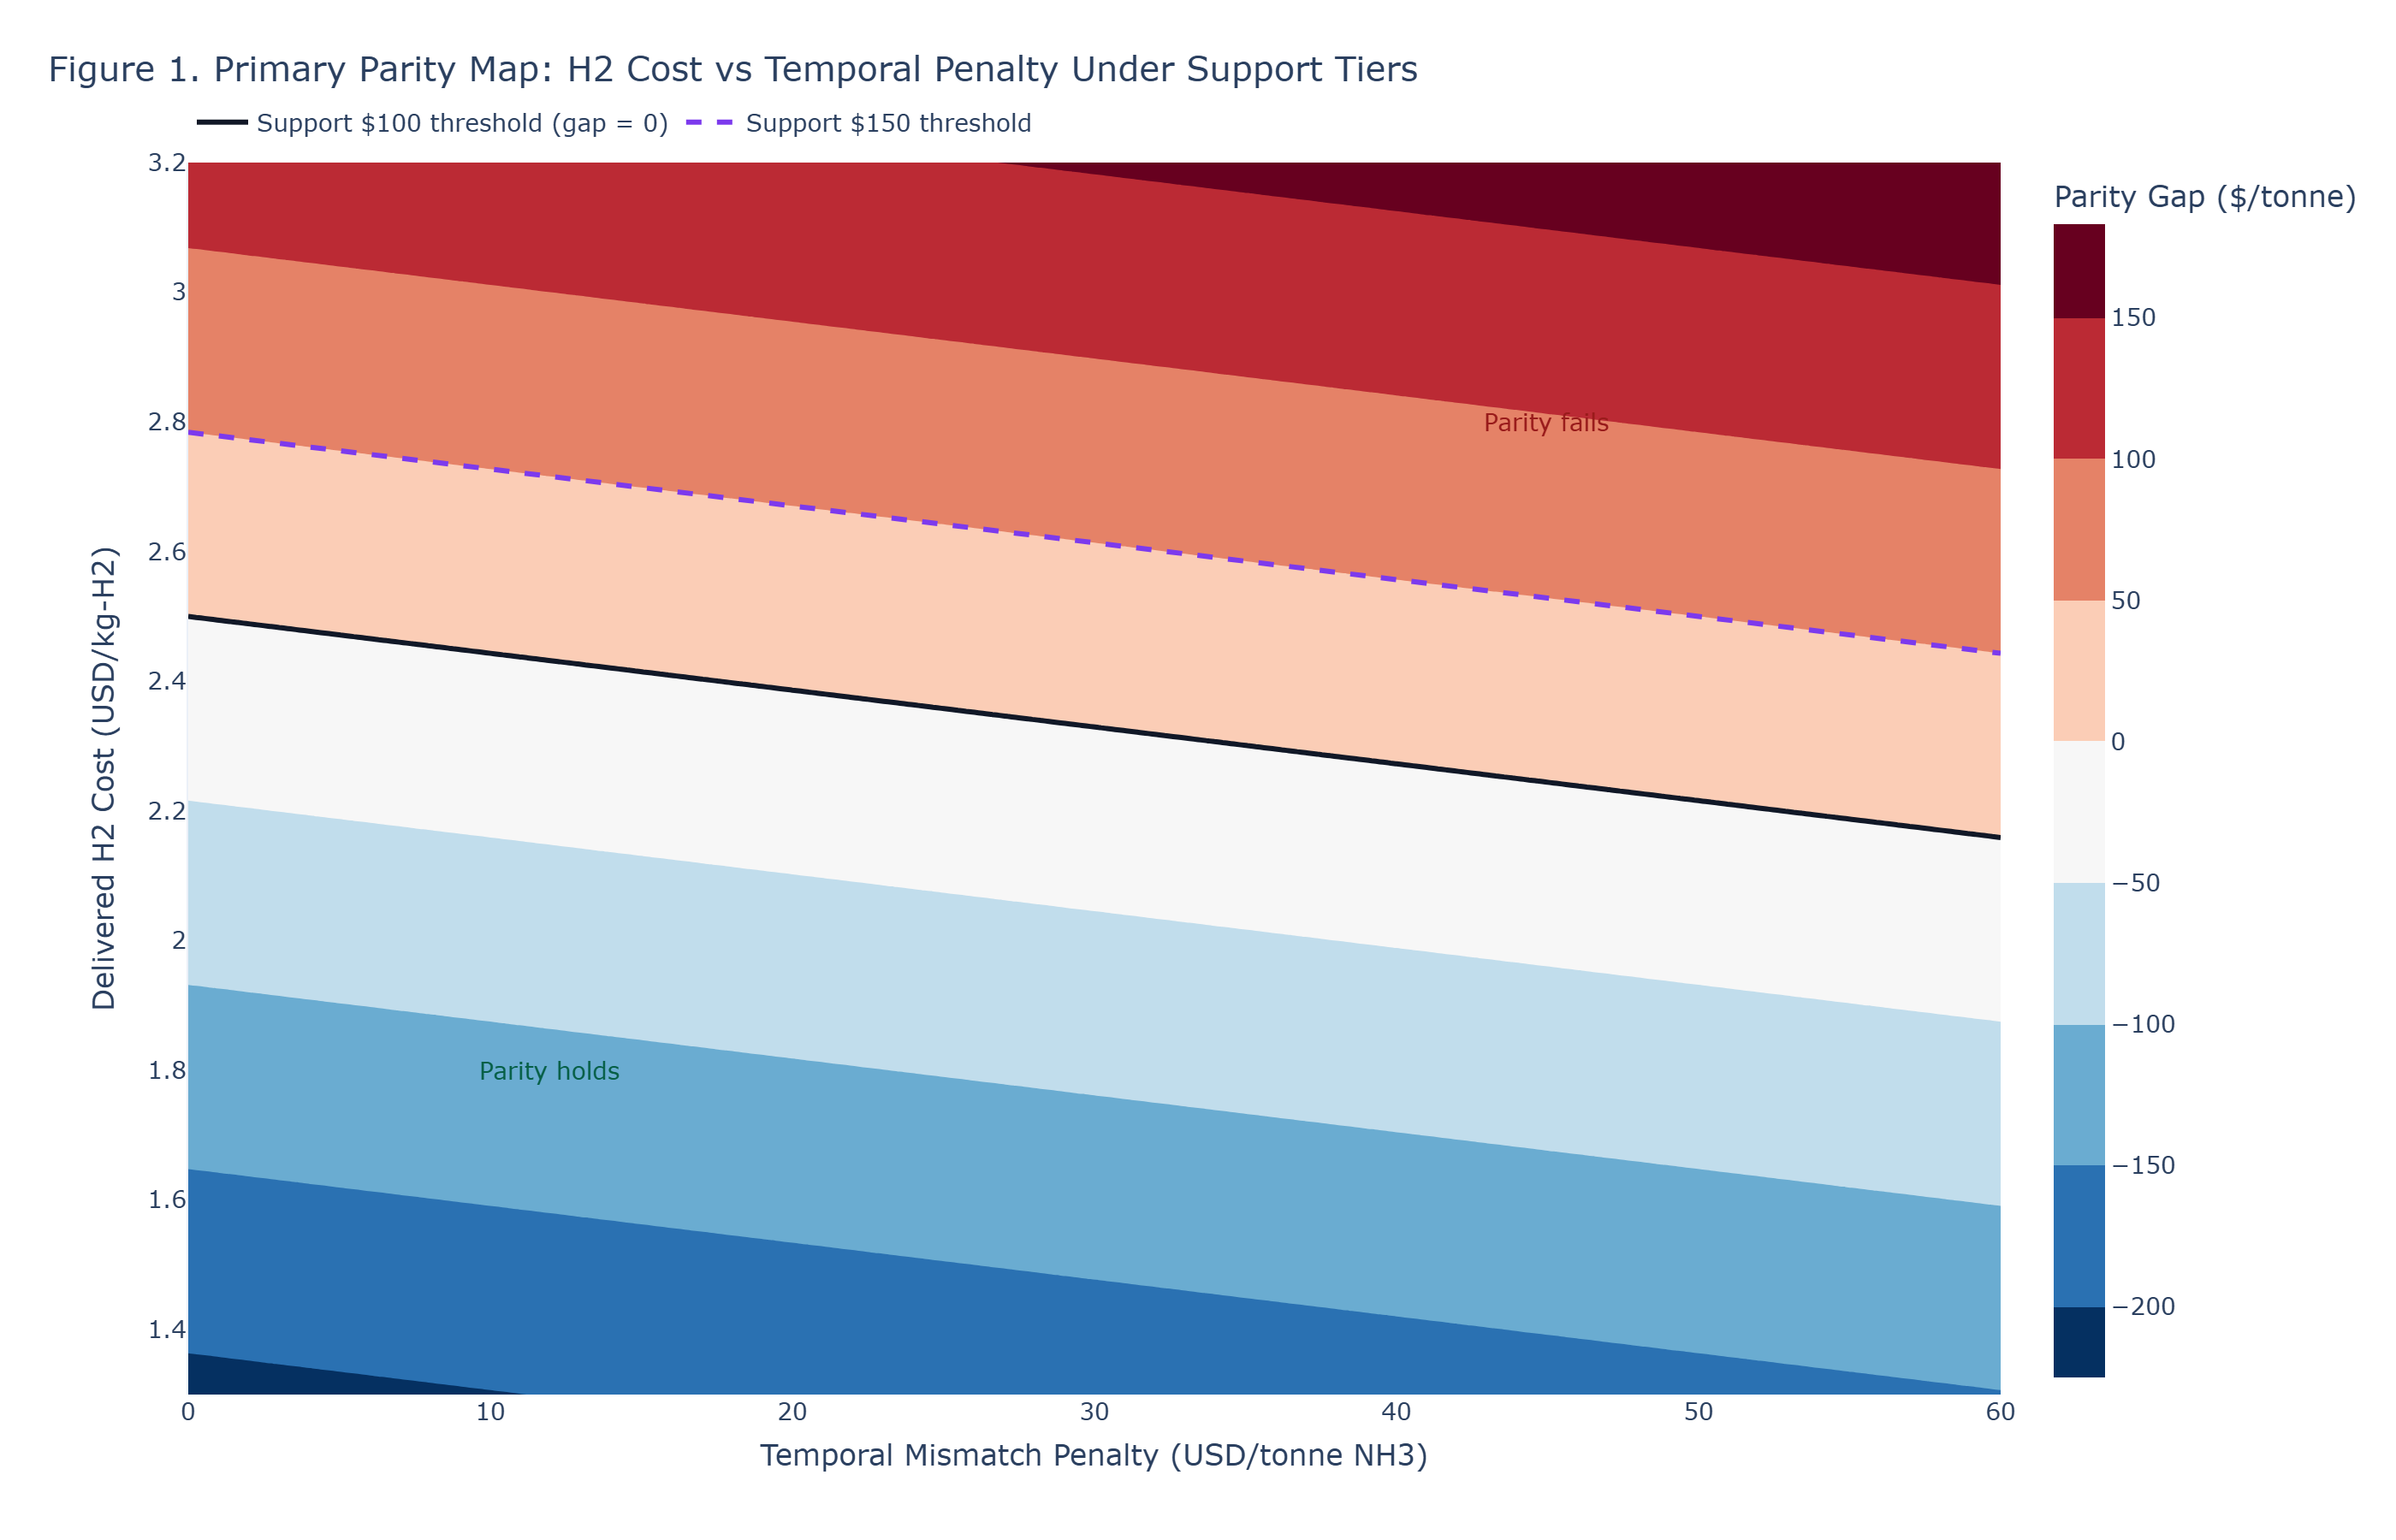
Figure 1: Parity boundary map in H2-cost and temporal-penalty space under benchmark and support assumptions.
Decision statement
- The parity region is concentrated in lower temporal-penalty and lower delivered-H2-cost regimes; boundary movement with support changes is first-order for screening.
Figure 2 - Hydrogen Threshold Sweep
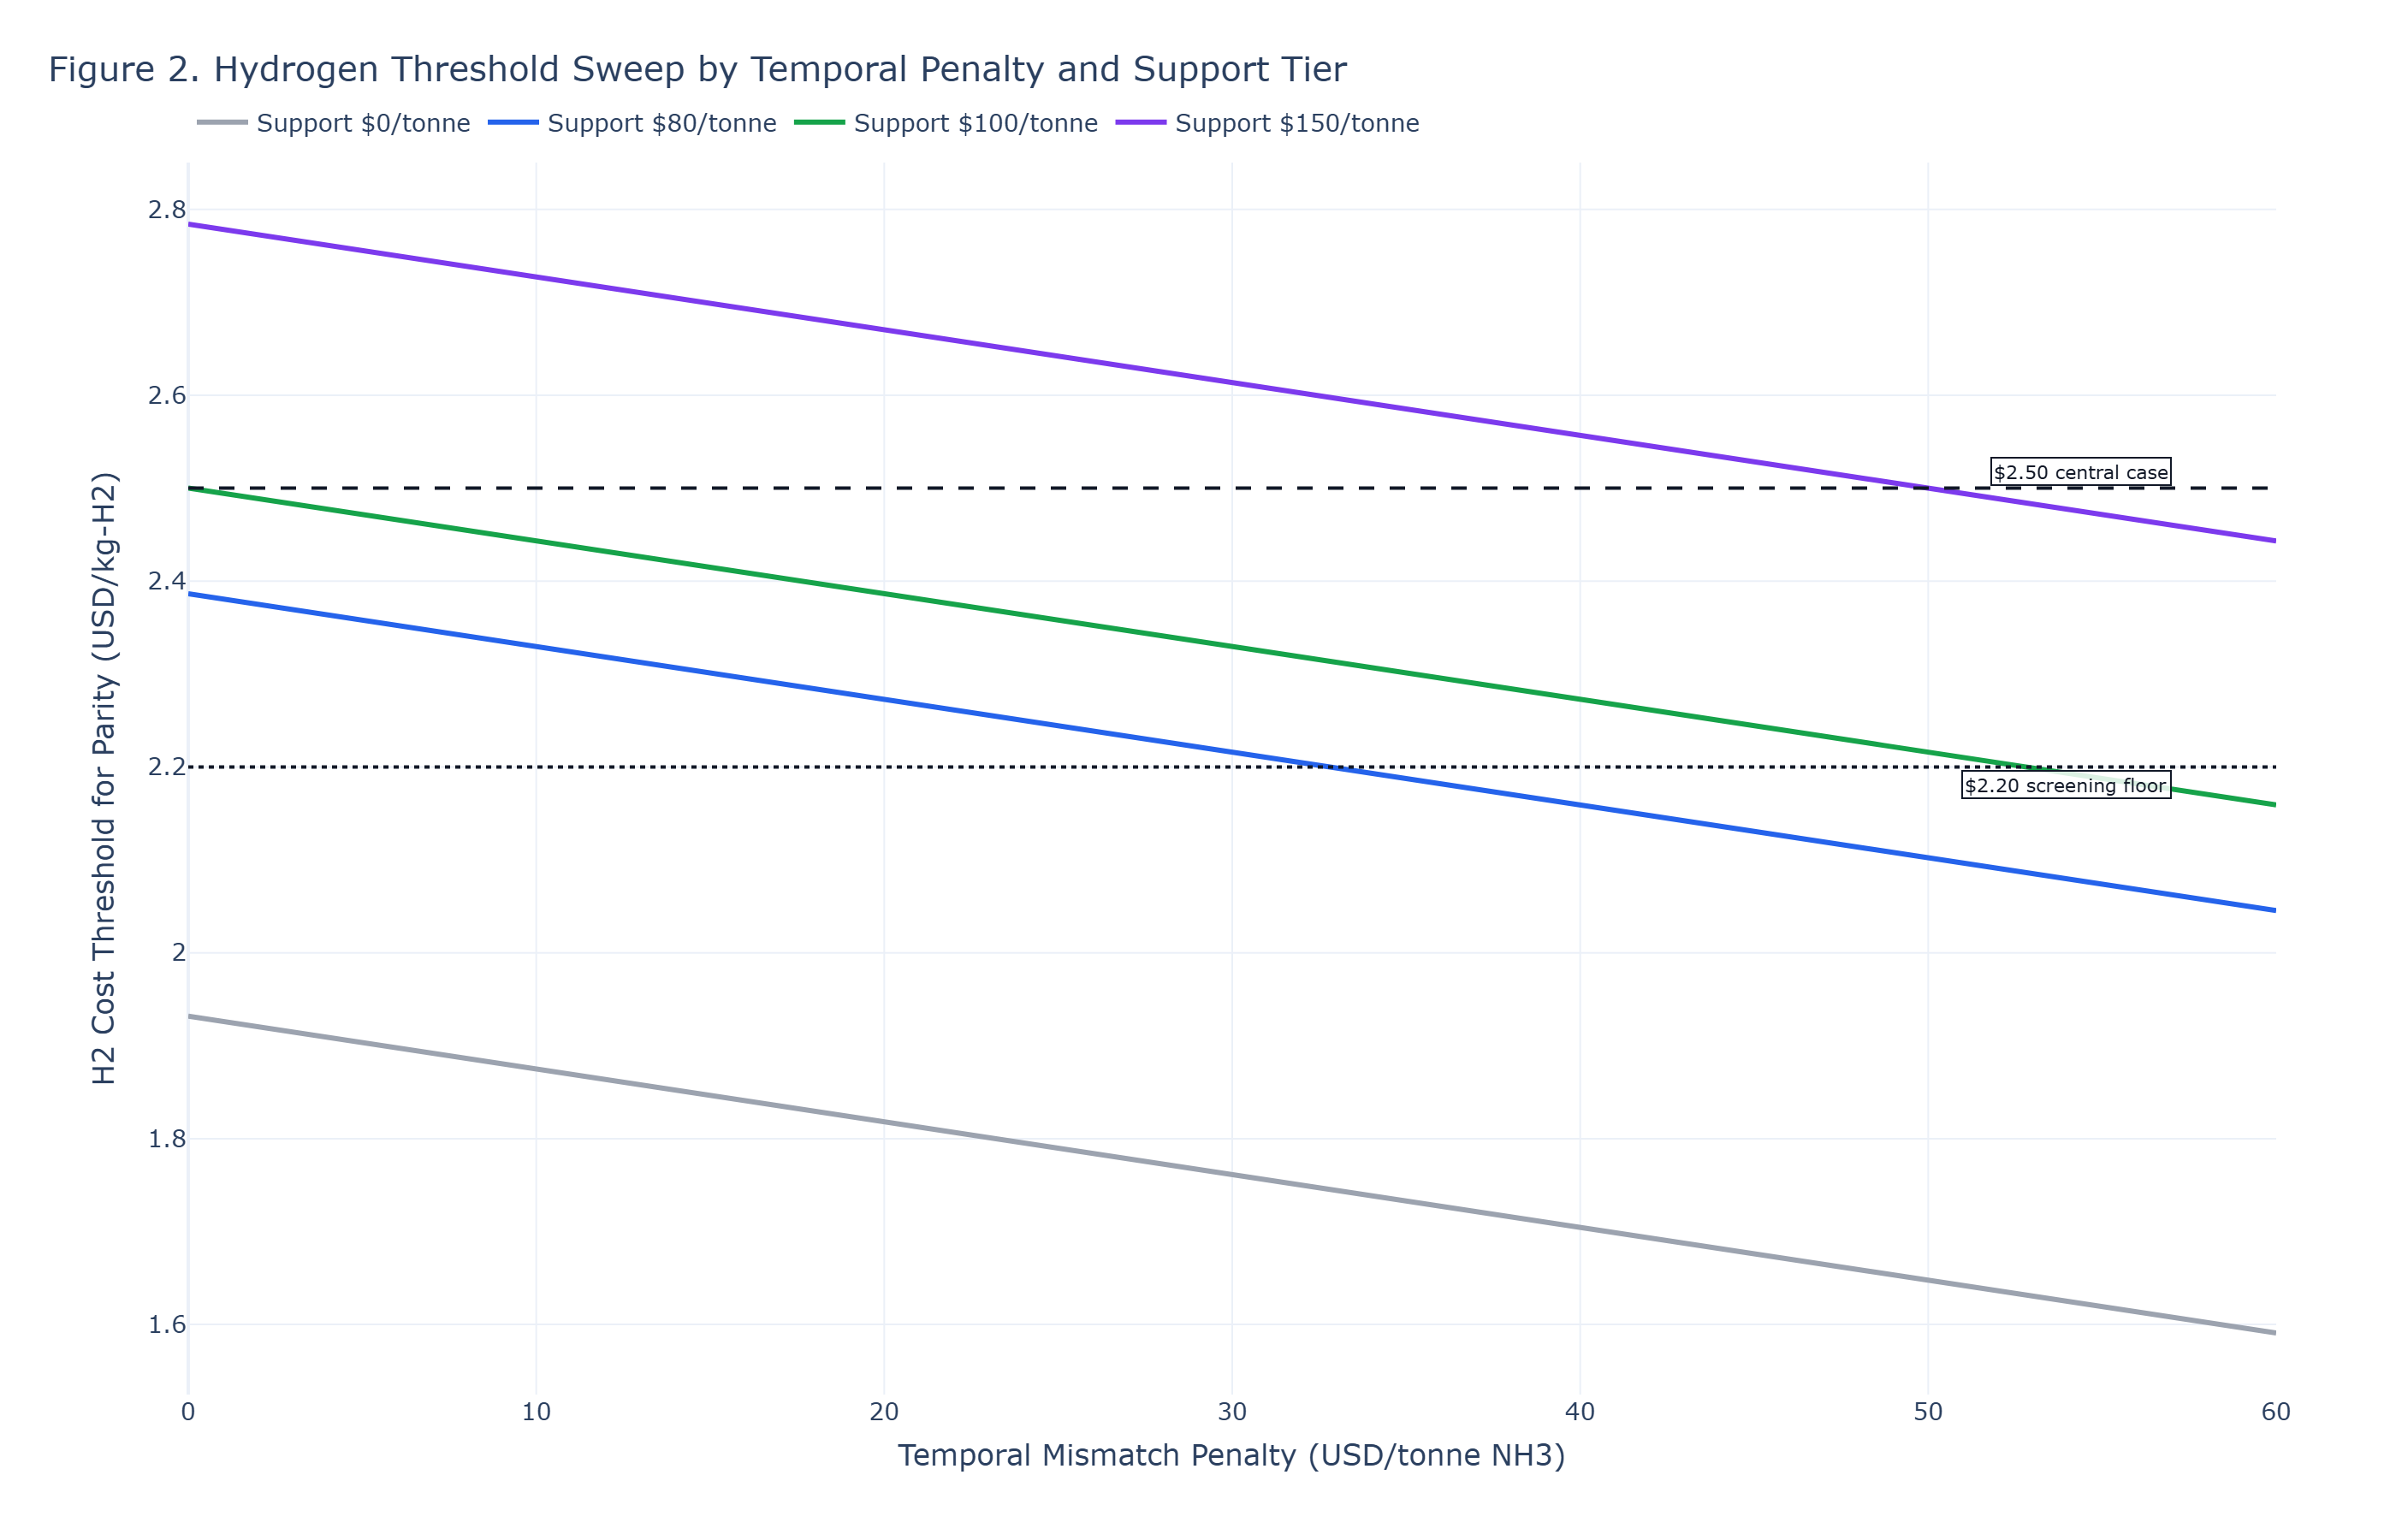
Figure 2: `H2_cost_threshold` sweep under support-tier and temporal-penalty scenarios.
Decision statement
- Under low support and rising temporal penalty, the allowed hydrogen-cost ceiling tightens into ranges that are difficult to underwrite without structural redesign.
Figure 3 - Decision Window Summary
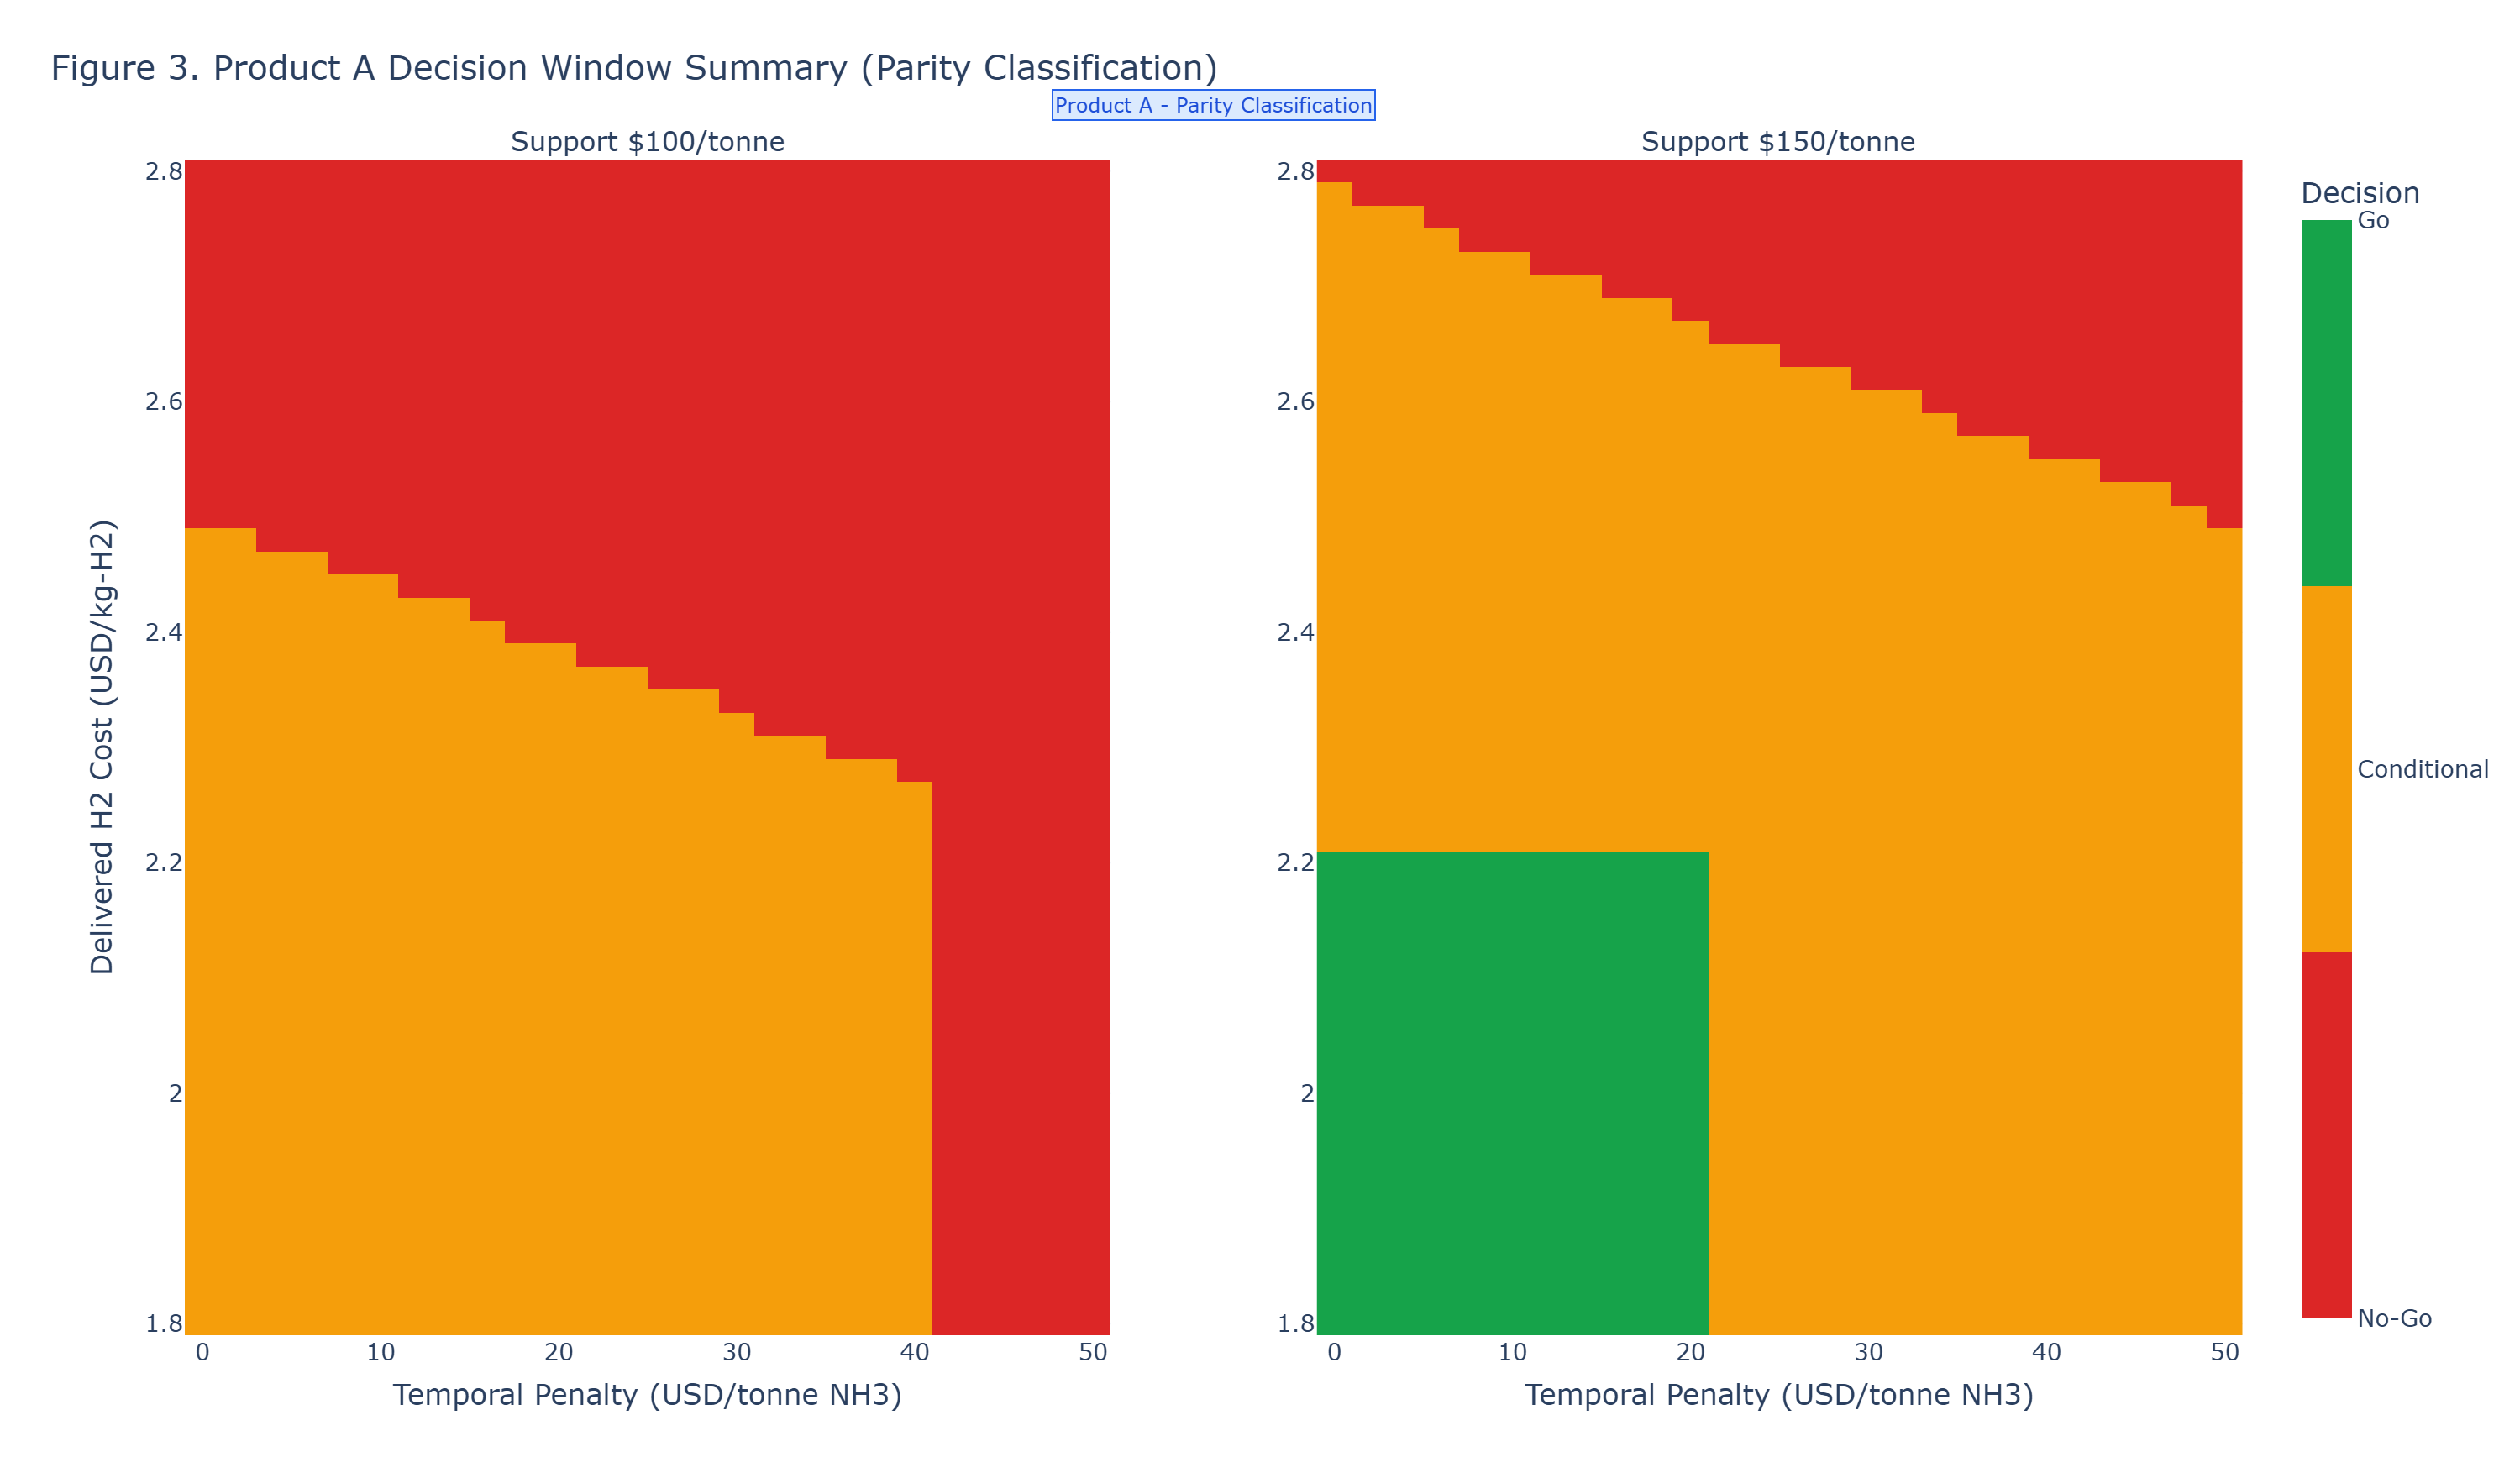
Figure 3: Go / Conditional Go / No-Go decision windows translated from the parity threshold equation.
Decision statement
- Conditional-Go windows are narrow and require formula-constrained validation; interior combinations that violate the threshold must be treated as No-Go.
Dominant variables (ranking)
- Delivered hydrogen cost (
$/kg-H2) - Temporal mismatch penalty (
$/tonne-NH3) - Realized policy-credit value (
$/tonne-NH3) - Effective synthesis utilization (through fixed-cost dilution)
Scope and limitations
- This is a structural parity screen, not an operational persistence conclusion.
- Project-level dispatch, storage, and contract structures are parameterized at screening level; full dynamic operations simulation remains out of scope.
Temporal mismatch converts low-cost energy into high-cost product.
Publication Completion Checklist
- DG-PFF execution trace included in decision brief
- Kill-condition callout format aligned
- Structural Claim and Constraint Statement included
- Confidence / robustness tag included
- Figure blocks include per-figure decision statements
- Final figure assets exported to
assets/img/notes/clean-ammonia-cost-parity-intermittent-hydrogen-continuous-synthesis/ - Source-validated benchmark ammonia price basis by region and contract basis
- Hourly hydrogen availability profile and storage operating strategy finalized
- Temporal-penalty decomposition calibrated with traceable coefficients
- Policy-credit realization and haircut assumptions finalized with jurisdictional traceability
Fragility Transition
The parity region identified in Product A holds only under sufficiently synchronized hydrogen availability and continuous synthesis demand. In real systems, this condition is rarely met. When mismatch penalties and utilization dilution are introduced, parts of this parity region collapse into non-viable space. Product B applies this persistence test and enforces the collapse boundary directly. Cases that enter Temporal Decoupling Failure Regime should not proceed to capital commitment. In DG-PFF handling, this regime is a direct No-Go classification unless structure is redesigned.
Companion linkage
Citation Readiness & Reproducibility
-
Publication date & version: April 2026 v1.0 - Canonical URL: https://insightquantix.com/insights/clean-ammonia-cost-parity-intermittent-hydrogen-continuous-synthesis/
- Inputs and thresholds: See threshold tables and linked artifacts in
assets/data/notes/clean-ammonia-cost-parity-intermittent-hydrogen-continuous-synthesis/. - Reproducibility note: Parity boundaries are most sensitive to delivered H2 cost, temporal-penalty decomposition, utilization assumptions, and realized policy support.
- Disclosure: Insight Quantix derived all analytical conclusions independently; external references provide context only.
How to Cite This Analytical Note
APA Format
Gomez, J. R. (2026). Clean Ammonia Cost Parity: When Intermittent Hydrogen Meets Continuous Synthesis (Insight Quantix Analytical Note IQ-AN-NH3-2026-01, v1.0). Retrieved from https://insightquantix.com/insights/clean-ammonia-cost-parity-intermittent-hydrogen-continuous-synthesis/
Chicago Format
Gomez, Jamie R. “Clean Ammonia Cost Parity: When Intermittent Hydrogen Meets Continuous Synthesis.” Insight Quantix Analytical Note IQ-AN-NH3-2026-01, v1.0, April 2026. https://insightquantix.com/insights/clean-ammonia-cost-parity-intermittent-hydrogen-continuous-synthesis/.
BibTeX
@techreport{Gomez2026_NH3_Parity,
  author = {Gomez, Jamie R.},
  title = {Clean Ammonia Cost Parity: When Intermittent Hydrogen Meets Continuous Synthesis},
  institution = {Insight Quantix},
  year = {2026},
  type = {Analytical Note},
  number = {IQ-AN-NH3-2026-01},
  month = apr,
  url = {https://insightquantix.com/insights/clean-ammonia-cost-parity-intermittent-hydrogen-continuous-synthesis/}
}
Appendix A: Modeling Parameters
- Model form: See the governing equations and threshold definitions in the technical section of this note.
- Primary data artifacts:
assets/data/notes/clean-ammonia-cost-parity-intermittent-hydrogen-continuous-synthesis/ - Primary figure artifacts:
assets/img/notes/clean-ammonia-cost-parity-intermittent-hydrogen-continuous-synthesis/ - Reproducibility scope: This appendix anchors file locations and parameter traceability for decision-grade review.
About the Author

About Insight Quantix
Insight Quantix publishes independent analytical work for transparency and decision clarity. The analysis examines benchmark-anchored, audit-defensible economic risk conditions relevant to capital allocation decisions in the $10M-$500M range.
Validation Methodology: ASTM E3200 | ISO 14040/14044 | NREL benchmark-anchored Engine Documentation: Available upon request Website: insightquantix.com
Legal Disclaimer
This analytical note is provided for informational and educational purposes only and does not constitute investment advice, financial advice, engineering design recommendations, or legal interpretation of tax policy. Readers should conduct independent due diligence and consult qualified professionals before making capital allocation decisions.
The analysis reflects representative scenarios based on stated modeling parameters and should not be construed as a guarantee of project performance or economic outcomes. Specific project economics require site-specific analysis accounting for local conditions, technology configurations, and regulatory environments.
Insight Quantix makes no warranties, express or implied, regarding the accuracy, completeness, or reliability of this information for any particular purpose.
© 2026 Insight Quantix. This analytical note may be cited with proper attribution.