45V Utilization Risk: When Cheap Power Breaks Clean Hydrogen Parity
Why low-cost electricity cannot rescue hydrogen economics when electrolyzer runtime falls below the cost-recovery threshold.
IQ-AN-H2-2026-02 · 2026-06-19 · v2.0 · 12 min read
Plain-English takeaway
Cheap power does not preserve hydrogen parity when the electrolyzer cannot run enough hours to recover fixed cost. In the corrected grid, the remaining grey-high edge case requires roughly 75% capacity factor under annual matching or 90% under hourly matching near $25/MWh nominal power. Grey-low and grey-mid parity are not observed.
Why this matters
Utilization is a gating variable, not a secondary sensitivity. Intermittency, matching constraints, curtailment, maintenance, and offtaker limits can push achieved runtime below the threshold assumed in a favorable model.Parity that cannot survive achieved runtime is not viability.
Version note: v2.0 updates structure, navigation, and visual presentation. The policy basis remains the source review documented through February 8, 2026; this revision is not a new legal or tax-policy determination.
Decision
Decision Summary
GO: No broad, robust parity region is observed in the corrected scenario grid.
CONDITIONAL / EDGE: Annual-matched, non-firmed procurement near $25/MWh with CF >= 75%, or hourly-matched, non-firmed procurement near $25/MWh with CF >= 90%, can preserve parity against the grey-high benchmark only.
NO-GO: Capacity factor below 35%, firmed-hourly configurations in the current run, claims against grey-low or grey-mid benchmarks, or projects without contractable utilization and delivered-power assumptions.
What drives the result
Achieved capacity factor: Fixed capital and operating costs are spread across fewer kilograms as runtime falls.
Delivered electricity cost: Matching, shaping, congestion, firming, transmission, and losses can erase a low nominal PPA.
Financing burden: Higher WACC and reduced operating hours move marginal parity cases into the failure region.
Credit realization: Eligibility and tier-boundary haircuts compress the remaining parity margin; utilization does not change the statutory per-kilogram rate for eligible output.
Decision
Kill Conditions
Treat the following configurations as immediate No-Go unless the operating, procurement, or commercial structure changes:
Modeled capacity factor below 35%. Fixed-cost recovery dominates and parity is not observed across the modeled delivered-price range.
No credible utilization floor. Merchant intermittent power or hourly matching without firming cannot be underwritten using optimistic nameplate runtime.
The edge case misses its strategy threshold. Annual-matched cases below roughly 75% CF and hourly-matched cases below roughly 90% CF do not preserve the observed grey-high parity near $25/MWh.
Firmed-hourly procurement in the current grid. No parity is observed across the modeled price and utilization range.
The case requires grey-low or grey-mid parity. Neither benchmark clears after the H2A 2024.2 correction.
Context
Technical Note (Audit Trail)
The sections below preserve the model definition, utilization and price sensitivities, policy mapping, figures, scope, limitations, and reproducibility record supporting the decision screen.
Context
1. Decision Context
This analysis begins where parity analysis ends. The economics of clean hydrogen under 45V are often summarized as a race to the lowest electricity price, but this framing obscures the dominant failure mechanism: electrolyzers must operate at sufficiently high and stable utilization to amortize capital costs and fully realize credit value.
Procurement strategies that prioritize low nominal electricity prices frequently introduce intermittency, curtailment, or matching constraints that suppress realized utilization. Under 45V, these utilization losses are amplified by eligibility and credit-tier rules, transforming what appears to be a continuous sensitivity into a discontinuous feasibility problem.
The failure chain is specific. Matching constraints reduce available operating hours. Reduced operating hours lower effective capacity factor. Lower capacity factor increases capital recovery per kilogram. Once capital recovery dominates the cost stack, electricity price savings no longer affect parity. The project fails not because power is expensive, but because the electrolyzer does not run enough to amortize itself.
Failure Logic
Premise: Low electricity prices typically require intermittent renewable procurement or constrained matching windows.
Outcome: Lower capacity factor increases levelized capital recovery per kilogram of hydrogen, overwhelming any electricity cost savings.
Conclusion: Price alone is insufficient. Without reliable utilization above the viability threshold, cheap power produces expensive hydrogen.
The relevant decision is not whether cheap power exists, but whether it can be converted into hydrogen production economics that beat grey at the user gate, while remaining inside a viable credit tier. This note quantifies where that conversion fails.
A custom engagement extends this public note by adding site-specific dispatch modeling, regional grid and deliverability overlays, and contract-structure review (PPA, firming, curtailment, and REC design) for a defined project boundary. It also stress-tests financing and credit-haircut interactions against your exact procurement stack, rather than benchmark screening ranges.
Where the companion parity analysis identifies the feasible regions for clean hydrogen cost competitiveness, this note examines why many projects fail to remain within them.
Context
1.1 Policy Context (Why Matching Rules Matter)
45V eligibility hinges on three constraints that directly amplify utilization risk:
Additionality - Electricity must come from generation capacity that would not have been built absent the hydrogen project. This limits access to existing low-cost baseload and pushes projects toward new-build renewables with inherently variable output.
Deliverability - The clean electricity must be deliverable to the electrolyzer location within the same region or balancing authority. Congestion, transmission constraints, and locational pricing differences can force projects to curtail or accept higher-cost power to maintain compliance.
Temporal matching - Under hourly matching, the electrolyzer can only run when matched clean generation is producing. This directly constrains capacity factor for intermittent-coupled projects and introduces weather-driven utilization volatility that annual matching would otherwise smooth.
These three pillars interact to create a utilization penalty that is not visible in nominal PPA pricing. A project with access to low-cost wind at $25/MWh may realize only 35-45% CF under hourly matching, pushing effective hydrogen cost above grey parity despite the apparent electricity price advantage.
Policy-Utilization Link
The 45V framework transforms cheap intermittent power from an advantage into a potential liability. Projects must evaluate not just electricity price, but the utilization regime implied by their compliance pathway.
1.2 TEA-LCA linkage under hourly matching
For 45V diligence, parity and emissions must be read together. The lifecycle intensity relevant to tier eligibility is production-weighted over matched operating hours:
When hourly matching suppresses operating hours, economics degrade through lower CF; separately, emissions outcomes depend on the carbon intensity of the matched electricity in the hours that do run. This note treats credit tier as a scenario input; project-level diligence should pair this TEA surface with an hour-resolved LCA check before underwriting Tier 1 value.
Method
2. Parity Claim
The parity claim tested here is that low nominal electricity prices can deliver clean hydrogen cost parity with grey hydrogen under 45V.
Method
3. Parity Metric
Parity in this note is defined at the boundary where delivered clean hydrogen cost equals delivered grey hydrogen cost for each benchmark band, conditional on procurement strategy and sustained utilization.
Traceable model form used in this note
For each scenario point, the model computes net LCOH as:
80,000 operating hours; replacement-cost treatment in OPEX sensitivity block
H2A notes + IQ degradation assumptions
Financial base case
7% real discount rate; 30-year life
Appendix A
Financial stress case
10% and 12% real discount-rate stress
Section 9 (added)
Efficiency conservatism (explicit)
The PEM assumption of 55 kWh/kg is intentionally conservative relative to best-in-class commercial claims (often ~47-52 kWh/kg on LHV basis). This pushes the parity boundary toward stricter conditions and should be interpreted as a prudence bias, not an optimistic case.
Sensitivity derivation (auditable)
From the equation above:
dLCOH / dP_MWh ~= e_kWhkg / 1000 -> approximately <strong>$0.050-$0.055 per kg per $/MWh</strong> for 50-55 kWh/kg.
Using the fixed-cost envelope implied by the CAPEX/WACC cases in this note, the CF derivative in the 40-60% region is approximately <strong>$0.03-$0.06 per kg per percentage-point CF</strong>, matching the reported cliff behavior order-of-magnitude.
Interpretation: local price and CF derivatives are both material, but realized project deviations are usually multi-point CF shifts (not single-point), which is why utilization remains the decision-flip driver in diligence.
H2A 2024.2 correction (what changed)
The prior publication mixed benchmark components that were not fully normalized to the same throughput basis. The 2024.2 correction reconciles CAPEX, OPEX, output denominator, and utilization basis onto one internally consistent reference scale before scenario sweeps are run.
This matters because utilization-risk conclusions are denominator-sensitive: when fixed-cost terms and output scale are consistently aligned, apparent parity area contracts materially. That is why the refreshed runs remove grey-mid parity in the modeled grid and leave only narrow grey-high edge cases.
Utilization governs fixed cost recovery and effective credit realization. Below a minimum capacity factor, even deeply discounted electricity cannot sustain parity with grey hydrogen.
Quantitative Signal
Model results show no grey-mid/low parity across the current modeled range after benchmark correction. Utilization remains the gating variable, but high utilization alone is insufficient without very low nominal electricity and favorable policy realization.
Driver 2 - Electricity Procurement Strategy
Matching regime and firming choices determine realized utilization, not just nominal price. Annual matching preserves higher utilization than hourly matching for intermittent supply; firming adds cost but stabilizes CF.
Quantitative Signal
Procurement strategies that reduce nominal electricity cost but simultaneously reduce utilization can result in net higher LCOH. The cheap power headline does not survive utilization-adjusted accounting.
Driver 3 - Capital Recovery Under Reduced Hours
Lower utilization increases per-kg capital burden, compounding electricity cost penalties. This effect is nonlinear: small utilization losses at low CF have outsized cost impacts.
Quantitative Signal
At approximately 50 percent CF, capital contribution to LCOH is materially higher than at 60 percent CF. This differential can exceed the cost savings from further electricity price reductions.
Utilization vs. price elasticity
Both levers are first-order and the model should show that explicitly.
Electricity-price derivative: approximately $0.050-$0.055/kg per $/MWh (from 50-55 kWh/kg intensity).
Utilization derivative (40-60% CF zone): approximately $0.03-$0.06/kg per percentage-point CF, depending on fixed-cost burden and financing assumptions.
The practical cliff behavior comes from scale of movement, not just local derivative. Procurement choices can shift realized CF by 5-20 percentage points, while negotiated power improvements are often single-digit $/MWh. That asymmetry is what collapses parity in real projects.
Practitioner Rule of Thumb
Screen decisions using combined shocks, not one-variable sensitivity. A 5 pp CF loss can erase the benefit of several $/MWh power-price improvement under typical 45V procurement structures.
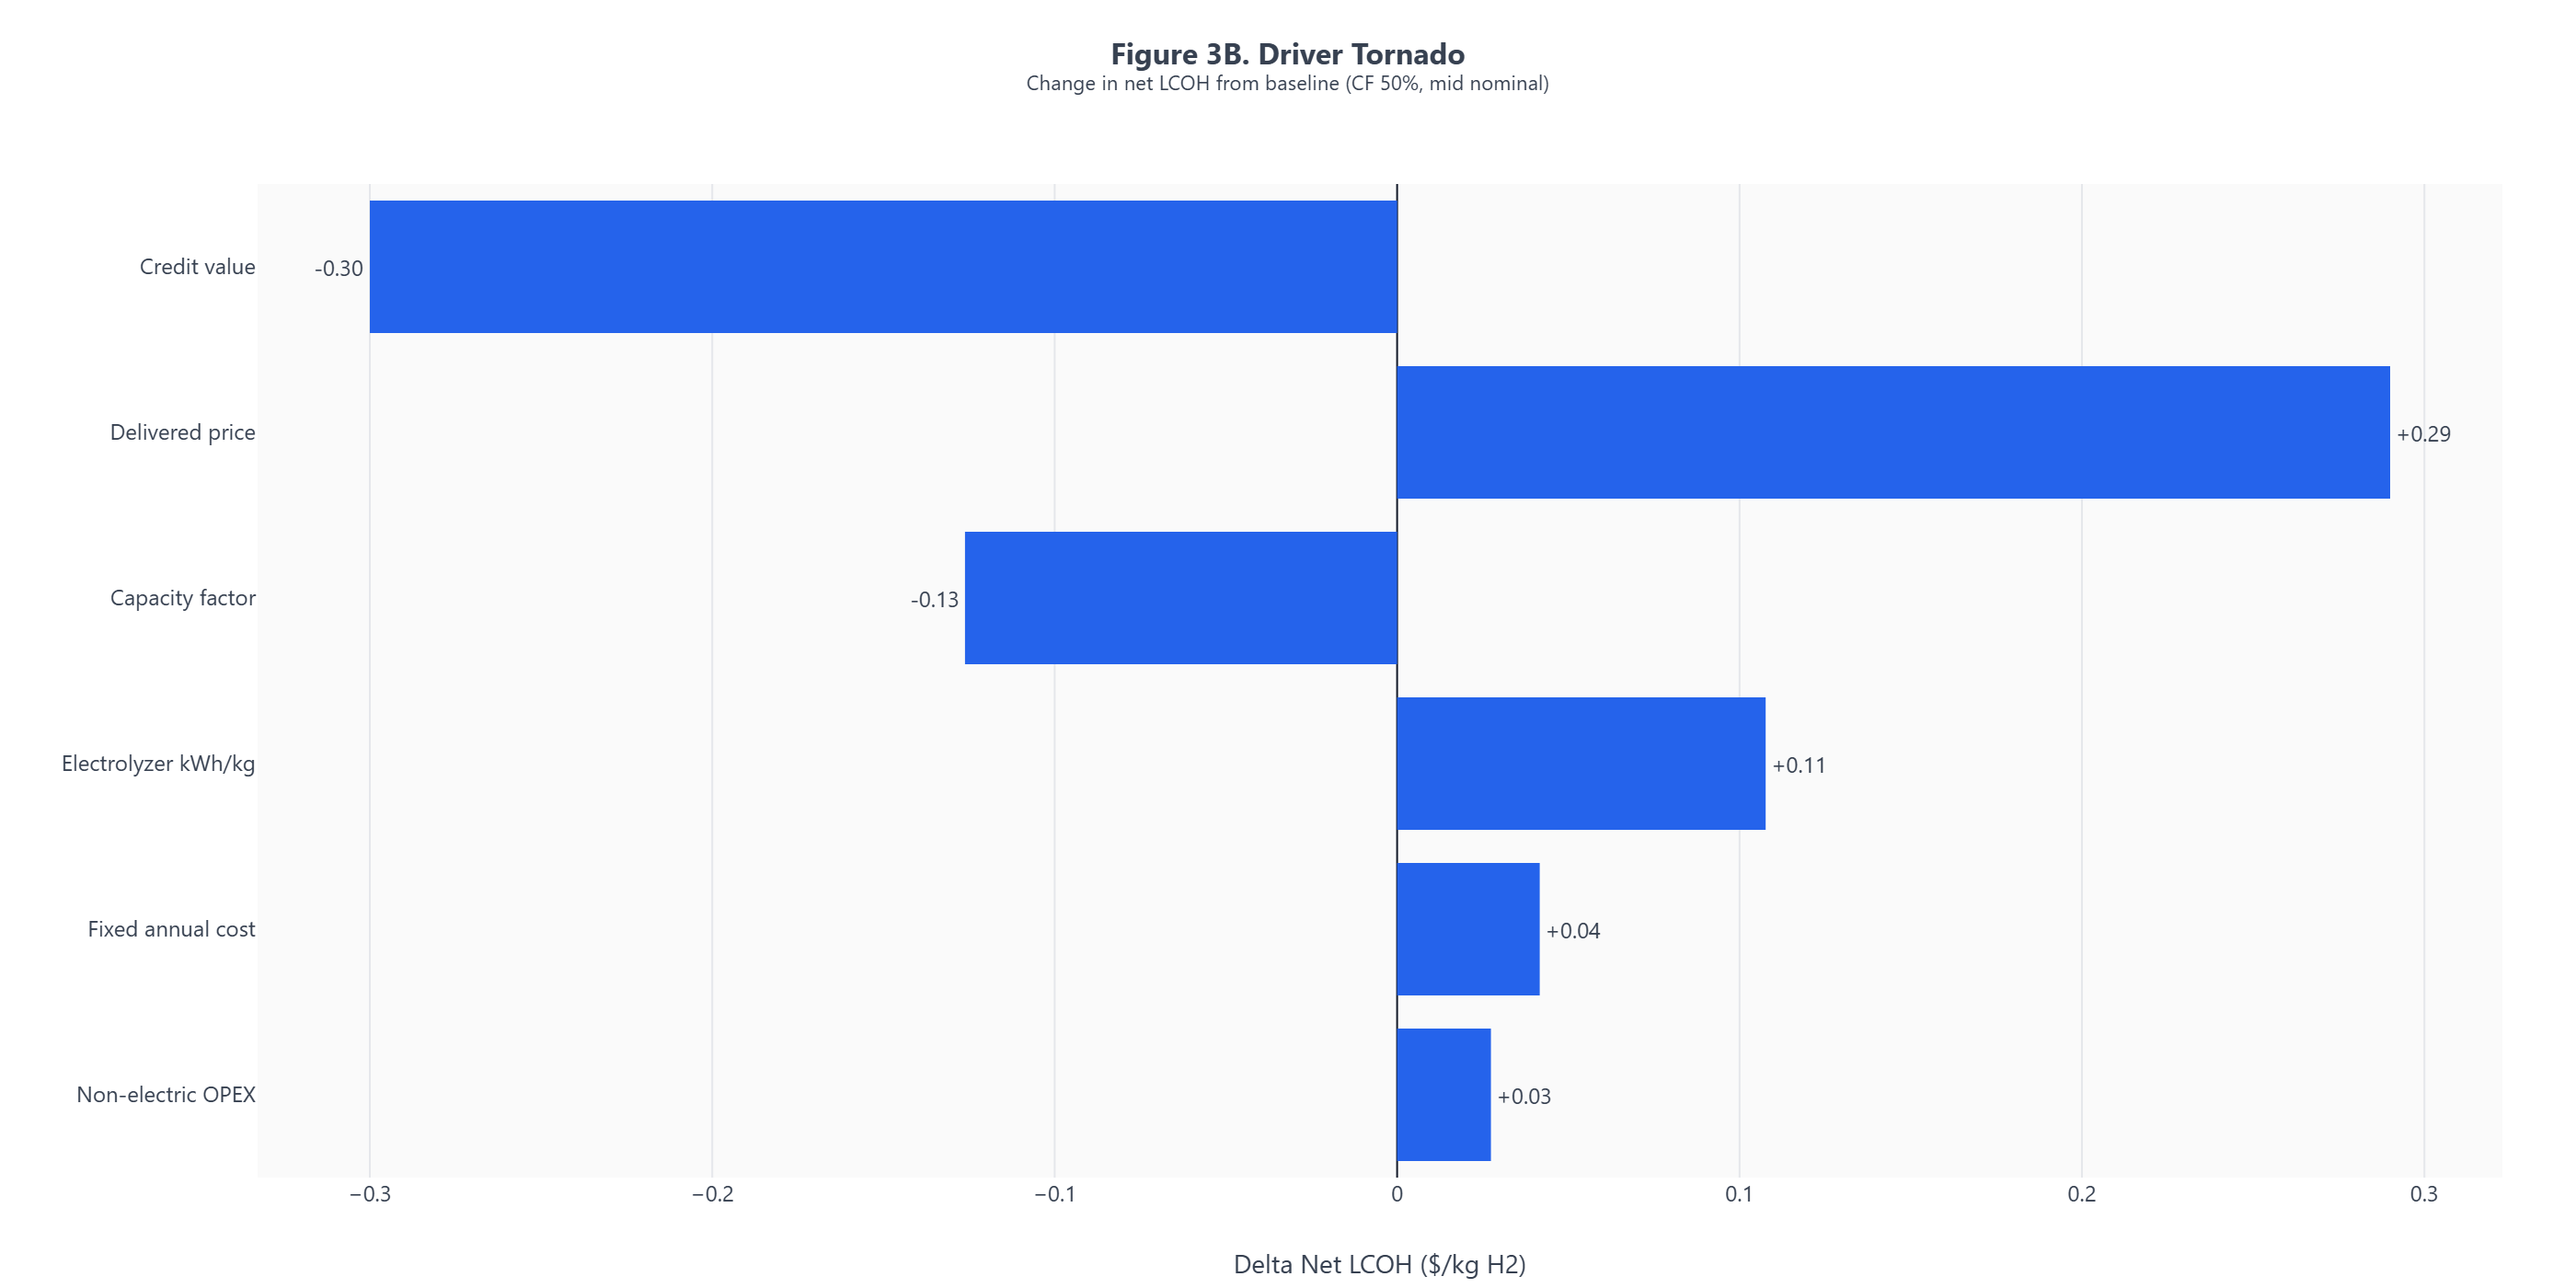
Figure 5 ranks the variables that move the parity boundary most. Focus on capacity factor and delivered electricity cost before secondary efficiency assumptions.
LCOH impact per unit change in each input variable
Figure 5: Tornado bars show one-step perturbations around the baseline point. Delivered electricity has strong per-unit slope, while utilization remains the dominant decision-flip variable because realistic CF deviations are larger and interact nonlinearly with fixed-cost recovery near the cliff region.
Key Takeaway
Utilization is the dominant fragility variable in project screening. Local one-step sensitivities alone are insufficient; what matters is that plausible utilization shocks are large, nonlinear near the cliff, and often coupled to procurement constraints. Secondary variables remain lower-priority for decision flips.
Decision relevance: Use the tornado ranking to prioritize diligence effort. Spend the most time validating utilization assumptions; spend less time refining secondary cost inputs that do not affect the viability decision.
Viability
5. Viability Region
The figures below are presented as decision thresholds and feasibility bands. Each figure is paired with the decision it informs.
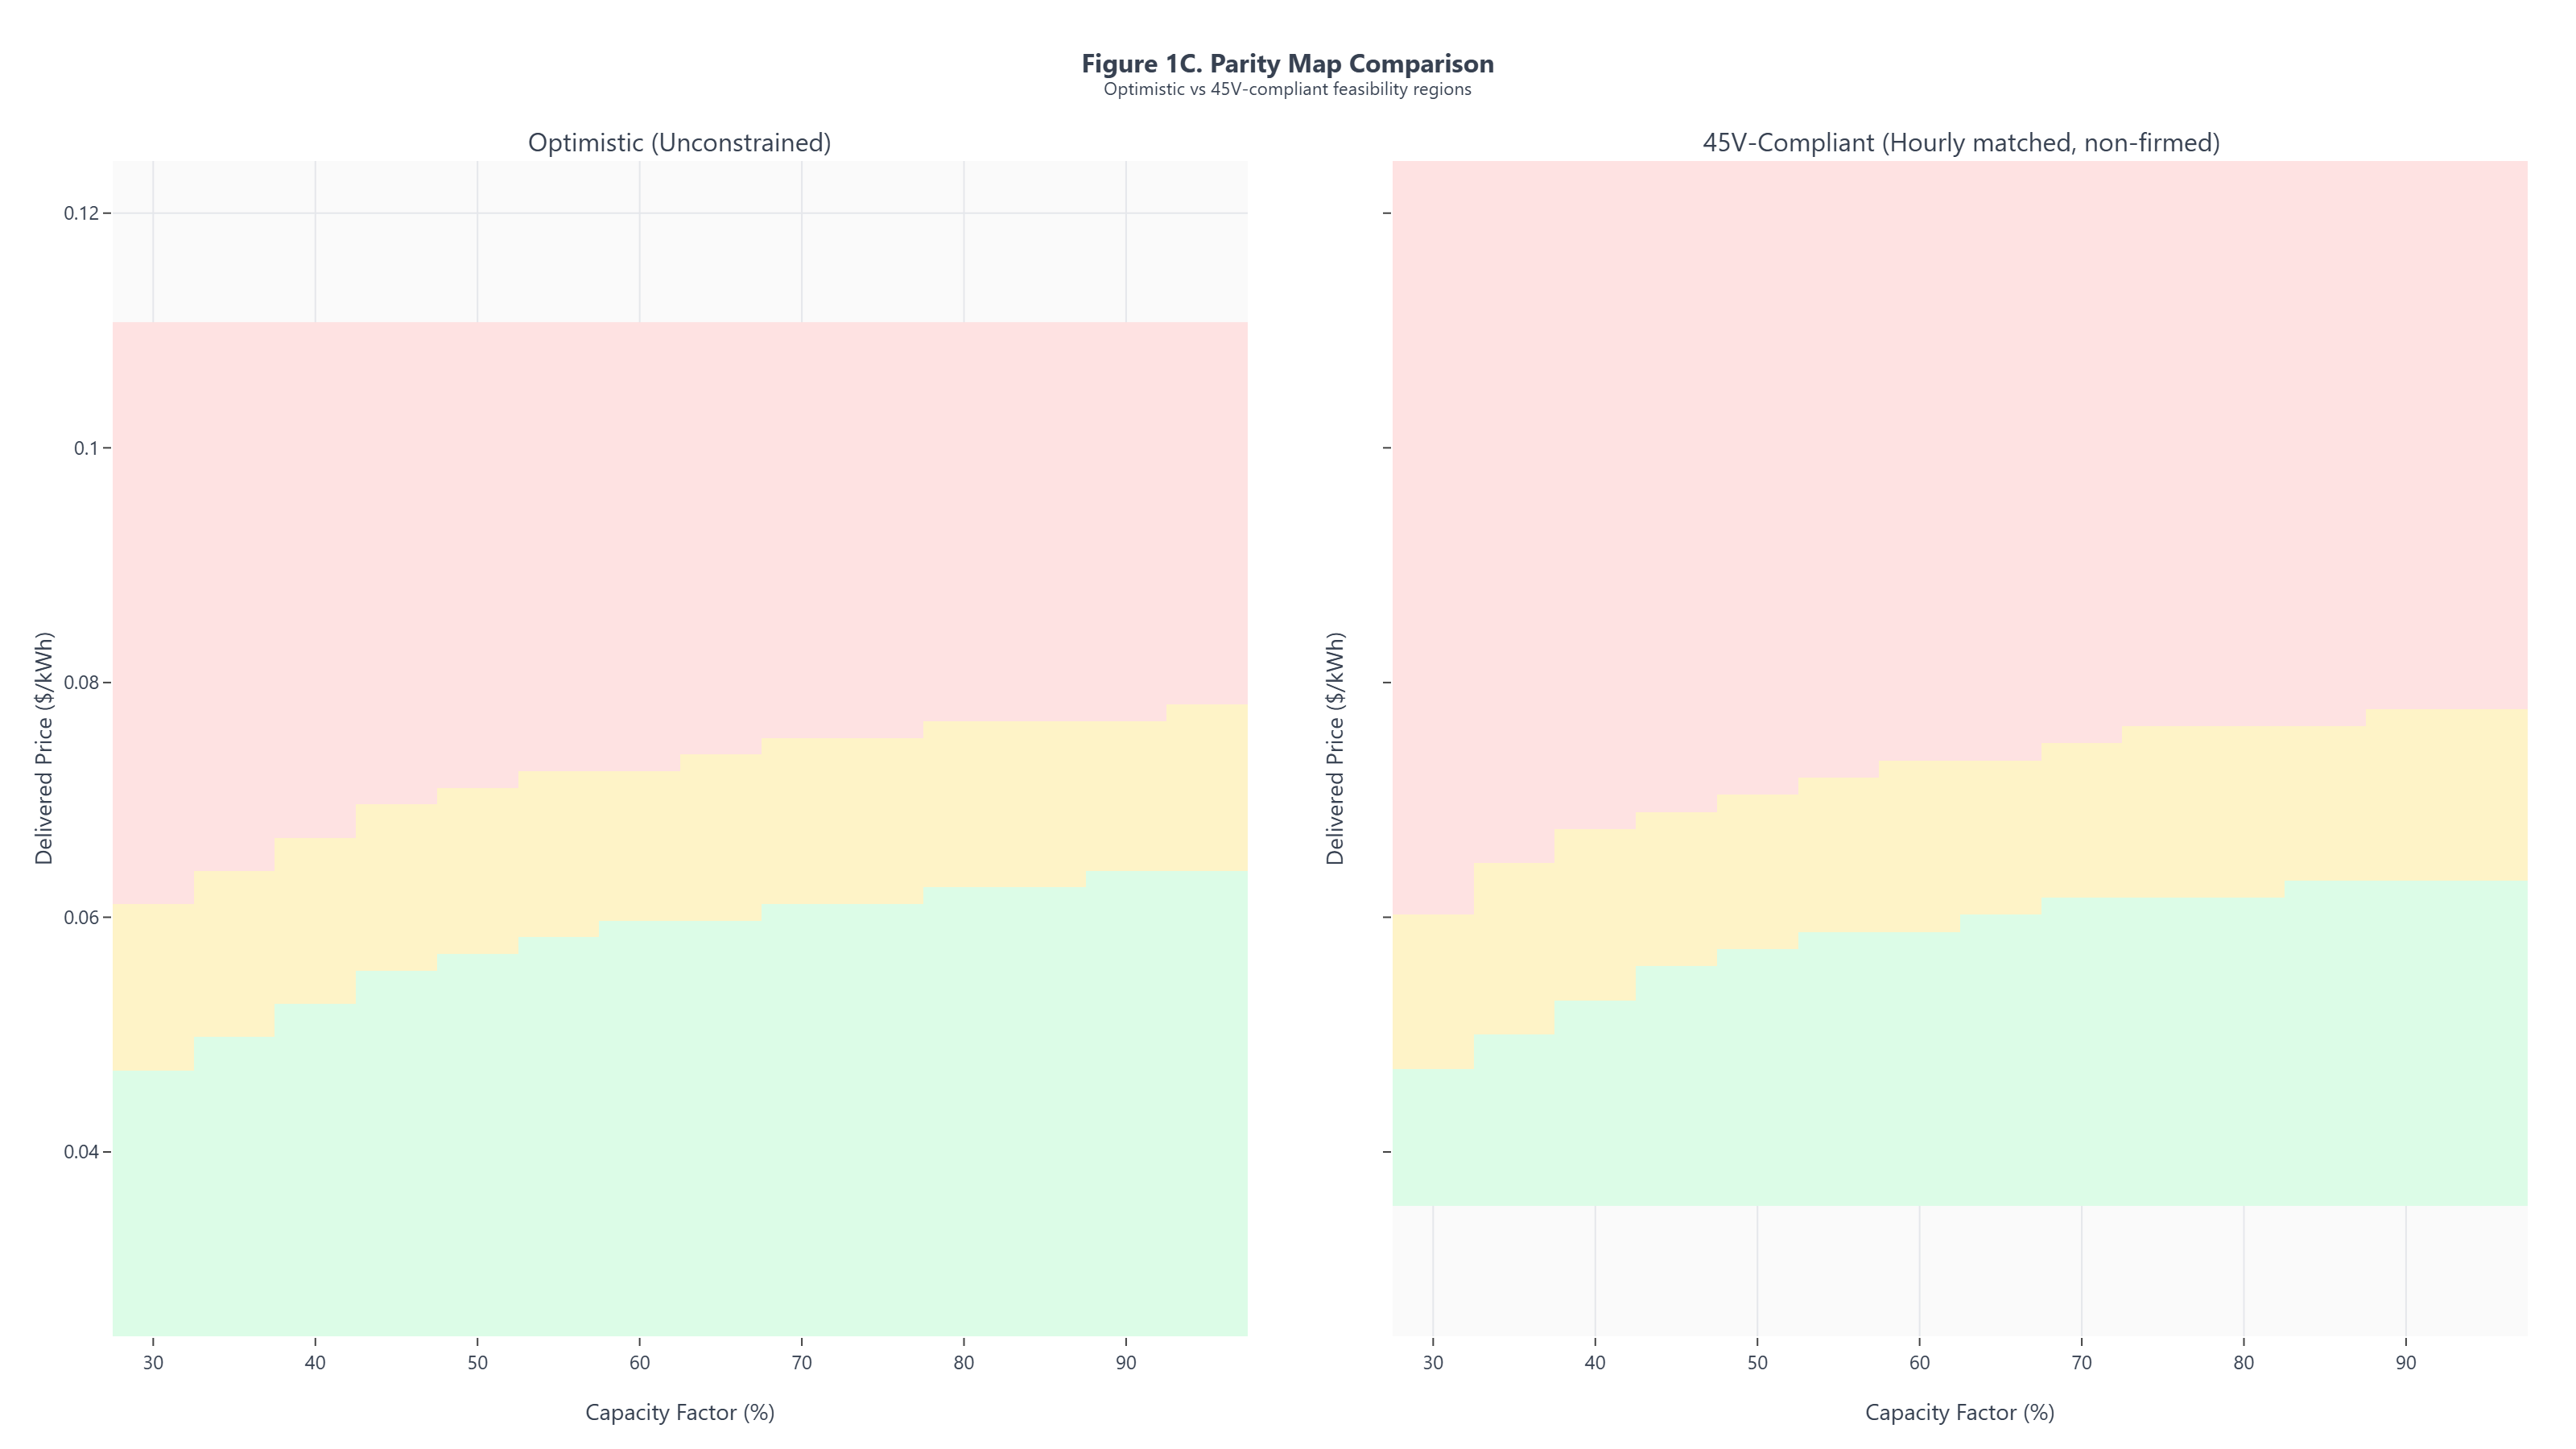
Figure 1 compares the corrected parity regions across procurement strategies. The decision signal is how little viable area remains once benchmark and delivery assumptions are aligned.
Contrast optimistic (unconstrained) vs 45V-compliant feasibility regions in delivered price x CF space.
Figure 1: Parity Map Comparison. Contrast optimistic (unconstrained) vs 45V-compliant feasibility regions in delivered price x CF space.
Key Takeaway
The comparison isolates the realism gap directly: optimistic assumptions overstate feasible parity area, while 45V-compliant constraints contract the viable region toward higher utilization and lower delivered price combinations.
Decision relevance: Use this side-by-side map to stress-test model assumptions and avoid screening decisions based on unconstrained parity regions that do not survive 45V-compliant operation.
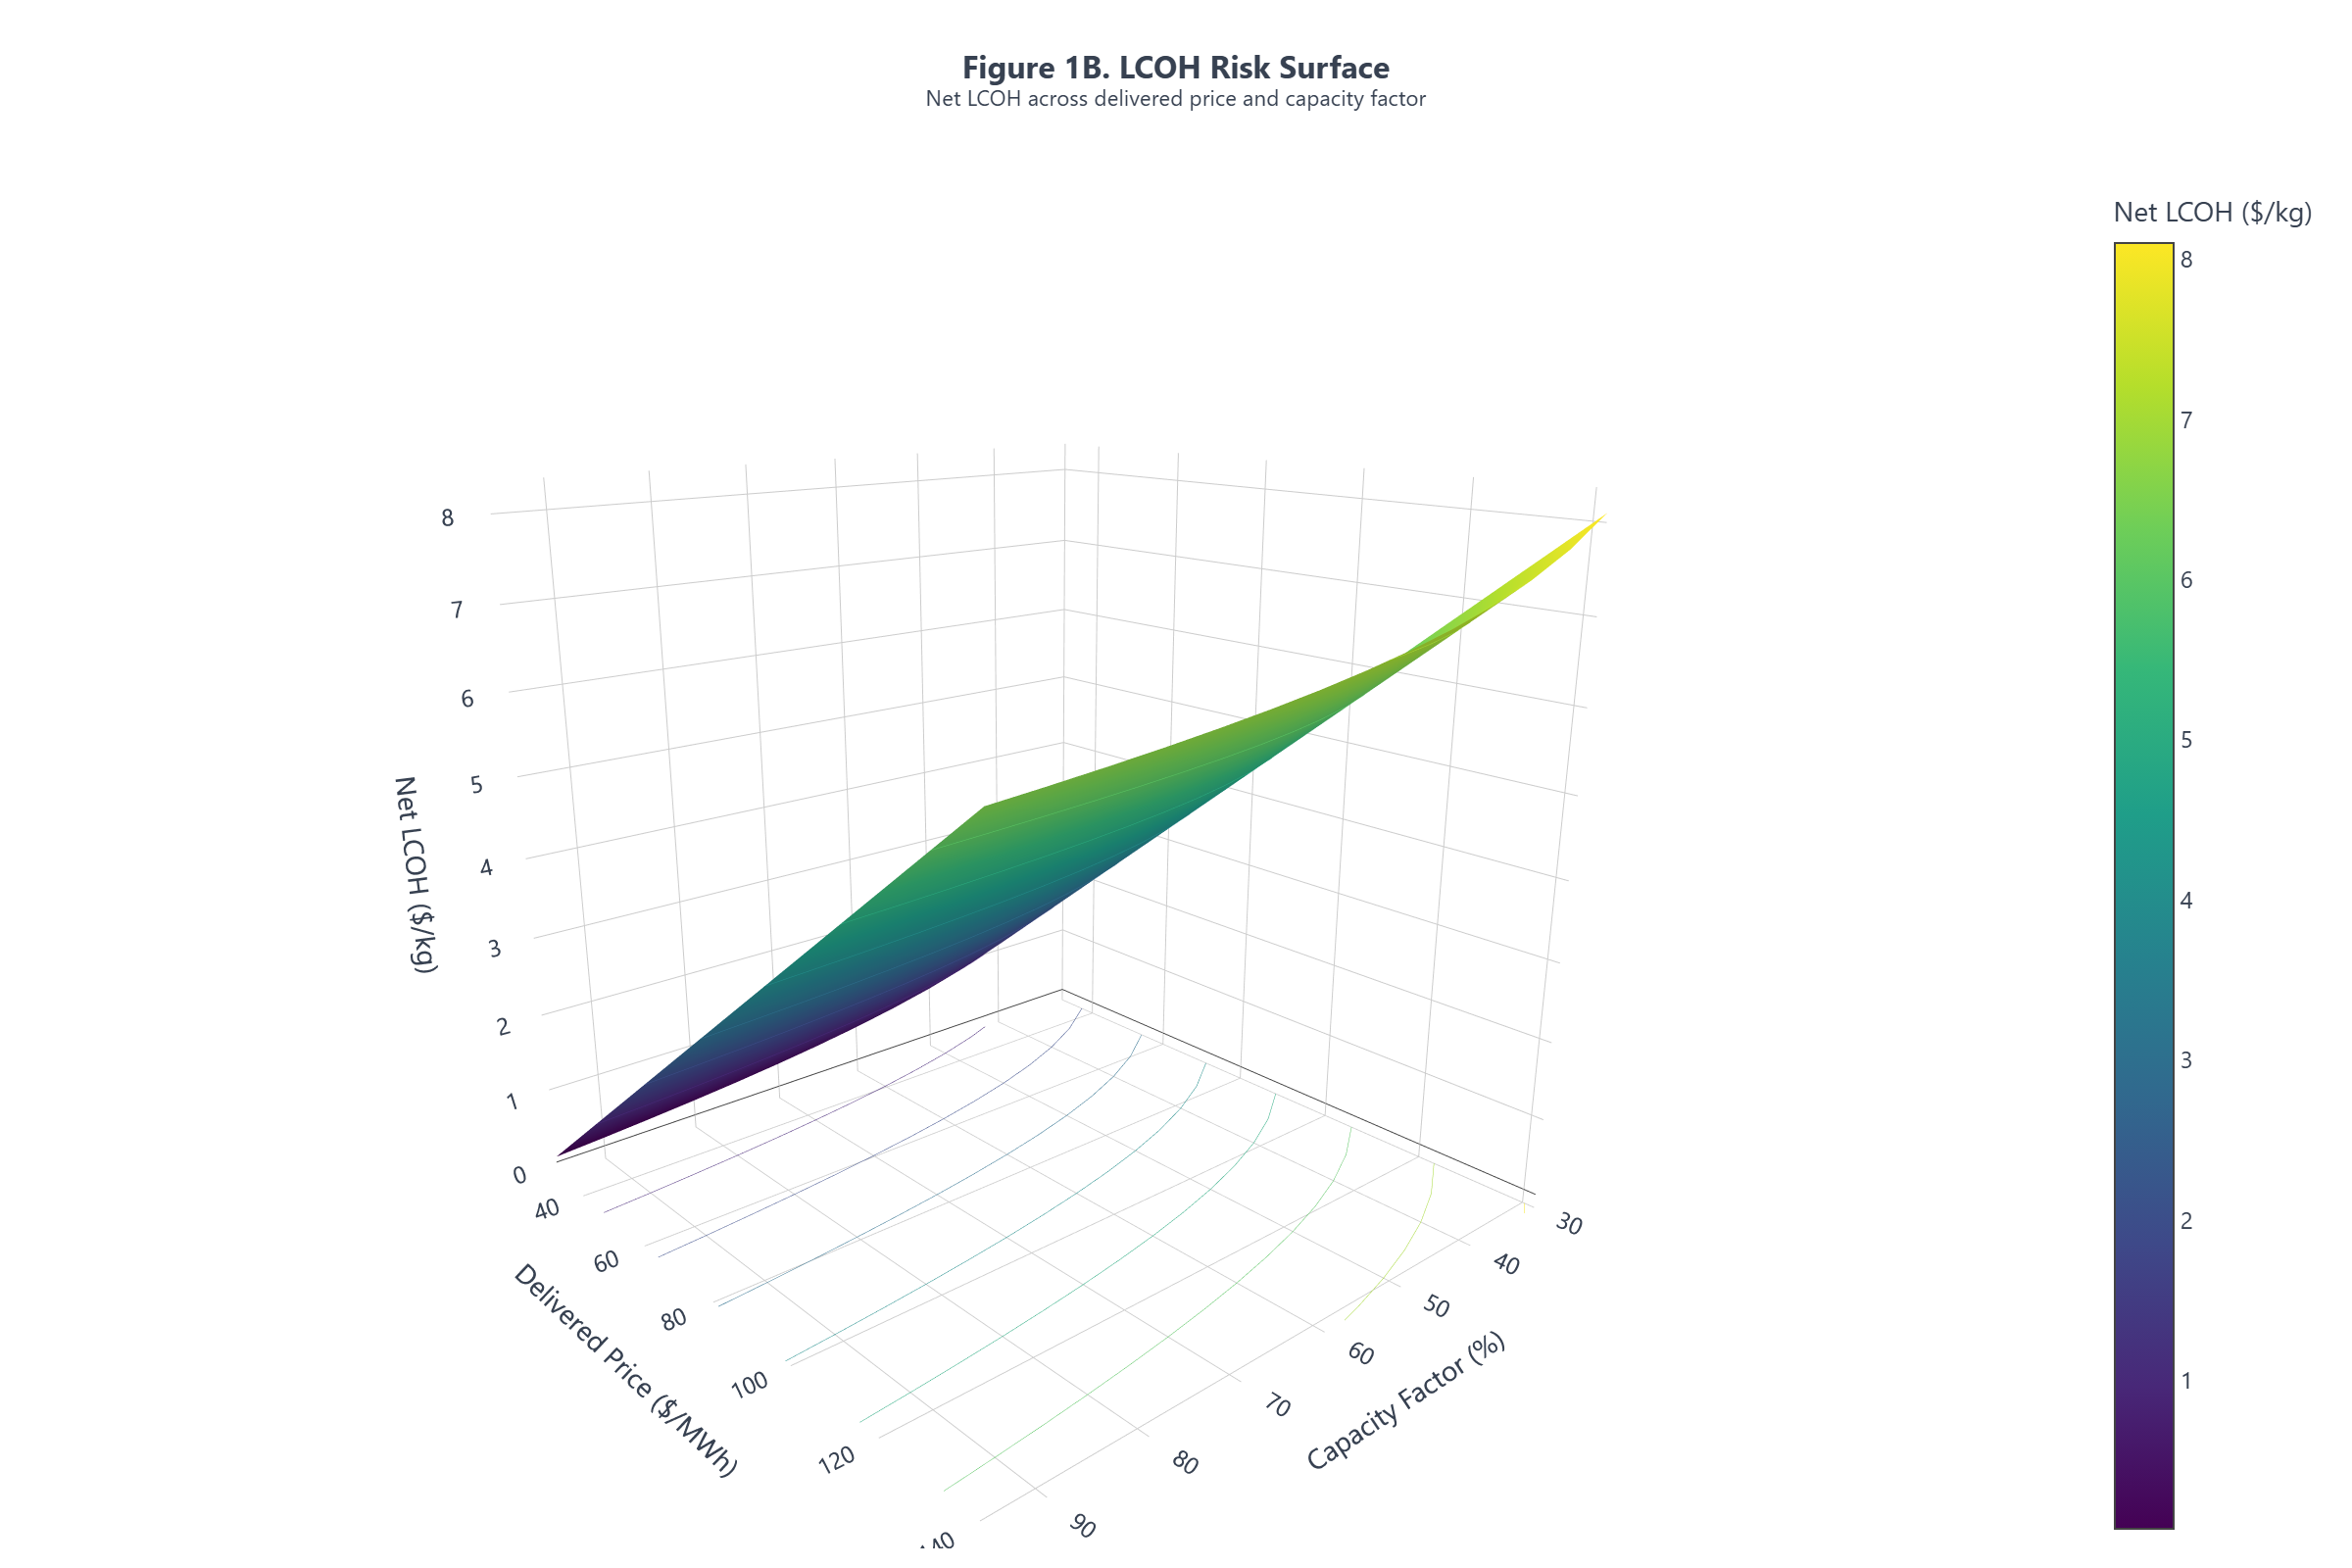
Figure 1B - LCOH Risk Surface
Figure 1B shows the joint effect of electricity price and utilization on levelized hydrogen cost. Follow the surface toward lower capacity factor to see fixed-cost amplification.
Delivered hydrogen cost as a function of electricity price and capacity factor
Figure 1B: The LCOH surface reveals the full cost landscape across the price-utilization domain. The steep wall below 50-60 percent CF confirms that cost behavior is cliff-like, not gradual. The flat region above 70 percent CF and below $40/MWh defines the structurally viable zone.
Key Takeaway
The surface makes visible what the threshold map implies: there is no smooth path from low utilization to parity. The cost landscape has a wall, not a slope. Projects on the wrong side of the wall cannot cost-optimize their way to viability through electricity price reductions alone.
Decision relevance: Use the surface plot to visualize the magnitude of cost penalties at different operating points. The vertical axis quantifies what the parity map shows as boundaries: how much cost increases when a project drifts outside the feasibility region.
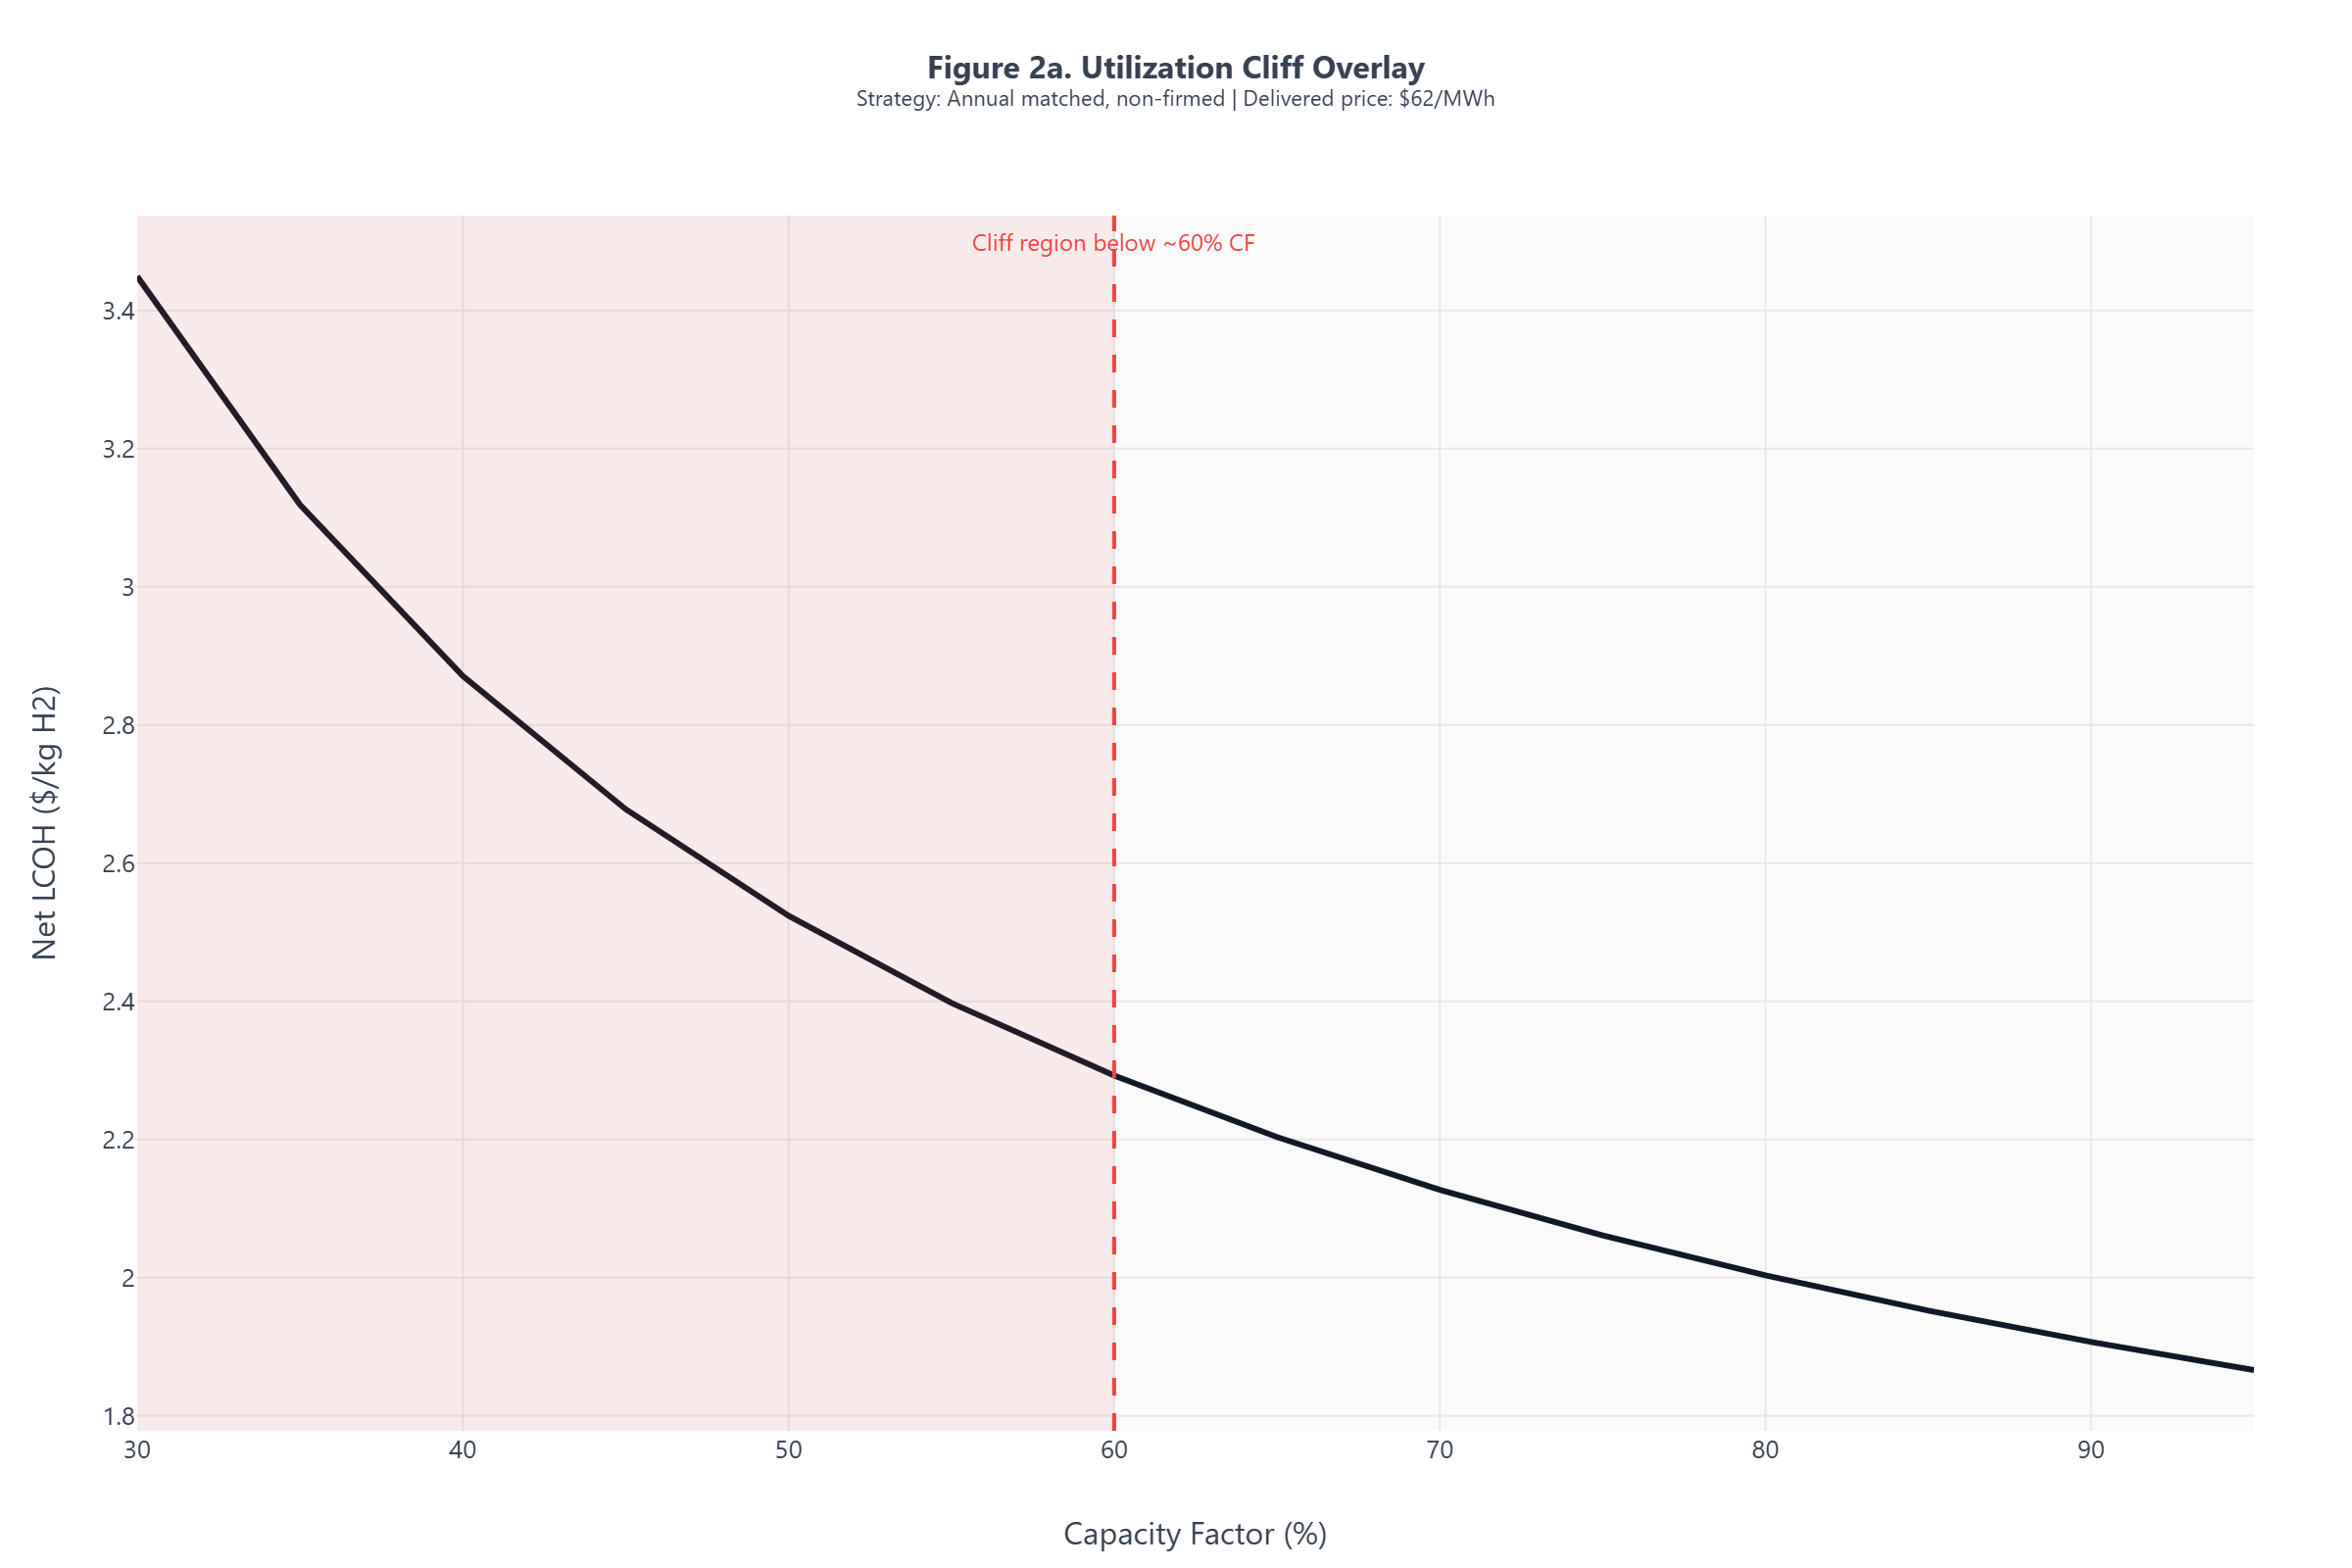
Figure 2 - Utilization Cliff Overlay
Figure 2 isolates the utilization cliff. Small runtime losses near the threshold can move a marginal case rapidly from conditional to non-viable.
Where small CF losses produce large cost jumps
Figure 2: Cost sensitivity to utilization is nonlinear. Below approximately 60 percent CF, small utilization losses produce disproportionate cost jumps that flip the decision from viable to non-viable.
Key Takeaway
Cost sensitivity to utilization is highly nonlinear below approximately 60 percent CF. Projects operating near this threshold carry asymmetric downside risk: small utilization losses flip the decision from viable to non-viable.
Note: Cliff behavior is amplified when credit-tier boundaries interact with utilization thresholds.
Decision relevance: Avoid sizing or procurement strategies that place expected utilization near the cliff region without substantial margin.
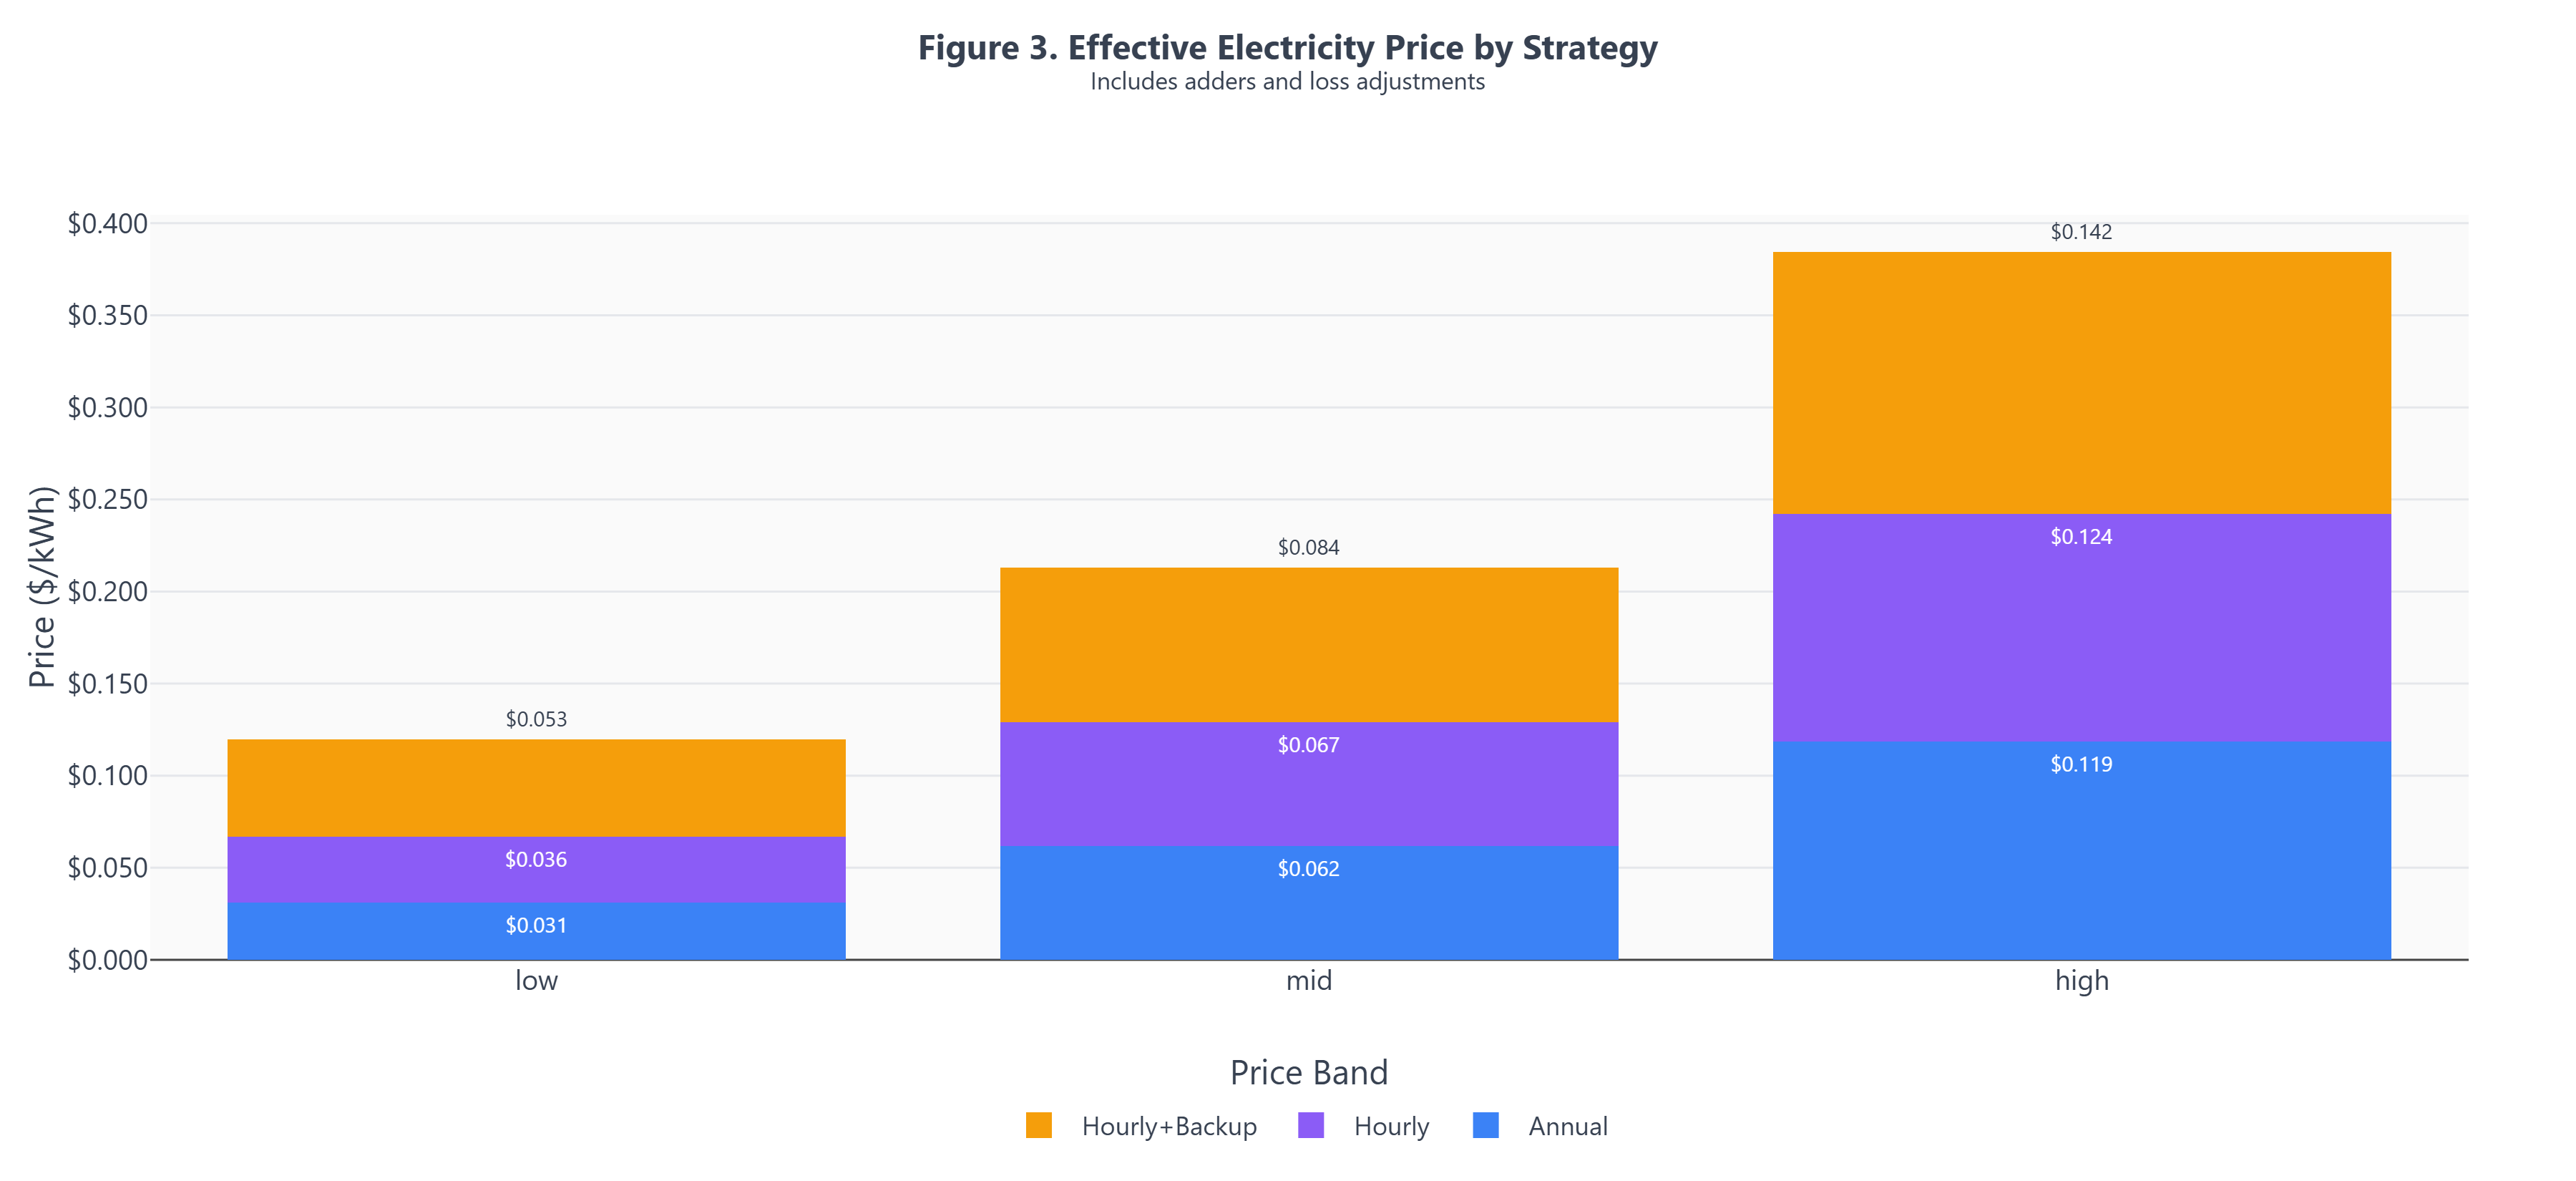
Figure 3 - Effective Electricity Price by Procurement Strategy
Figure 3 translates nominal procurement prices into delivered electricity cost after strategy-specific adders and losses.
Includes adders, losses, and utilization effects
Figure 3: Nominal PPA price is not the decision variable. Once matching, firming, and utilization penalties are included, some higher-priced firm strategies deliver lower hydrogen cost than cheaper intermittent strategies.
Key Takeaway
Nominal PPA price is not the decision variable. Once utilization effects are included, some "expensive" firm power strategies deliver lower hydrogen cost than "cheap" intermittent strategies with utilization collapse.
Note: Effective price reflects nominal price plus modeled adders and loss penalties, adjusted for utilization impact on capital recovery.
Decision relevance: Evaluate procurement options on effective hydrogen cost, not headline electricity price.
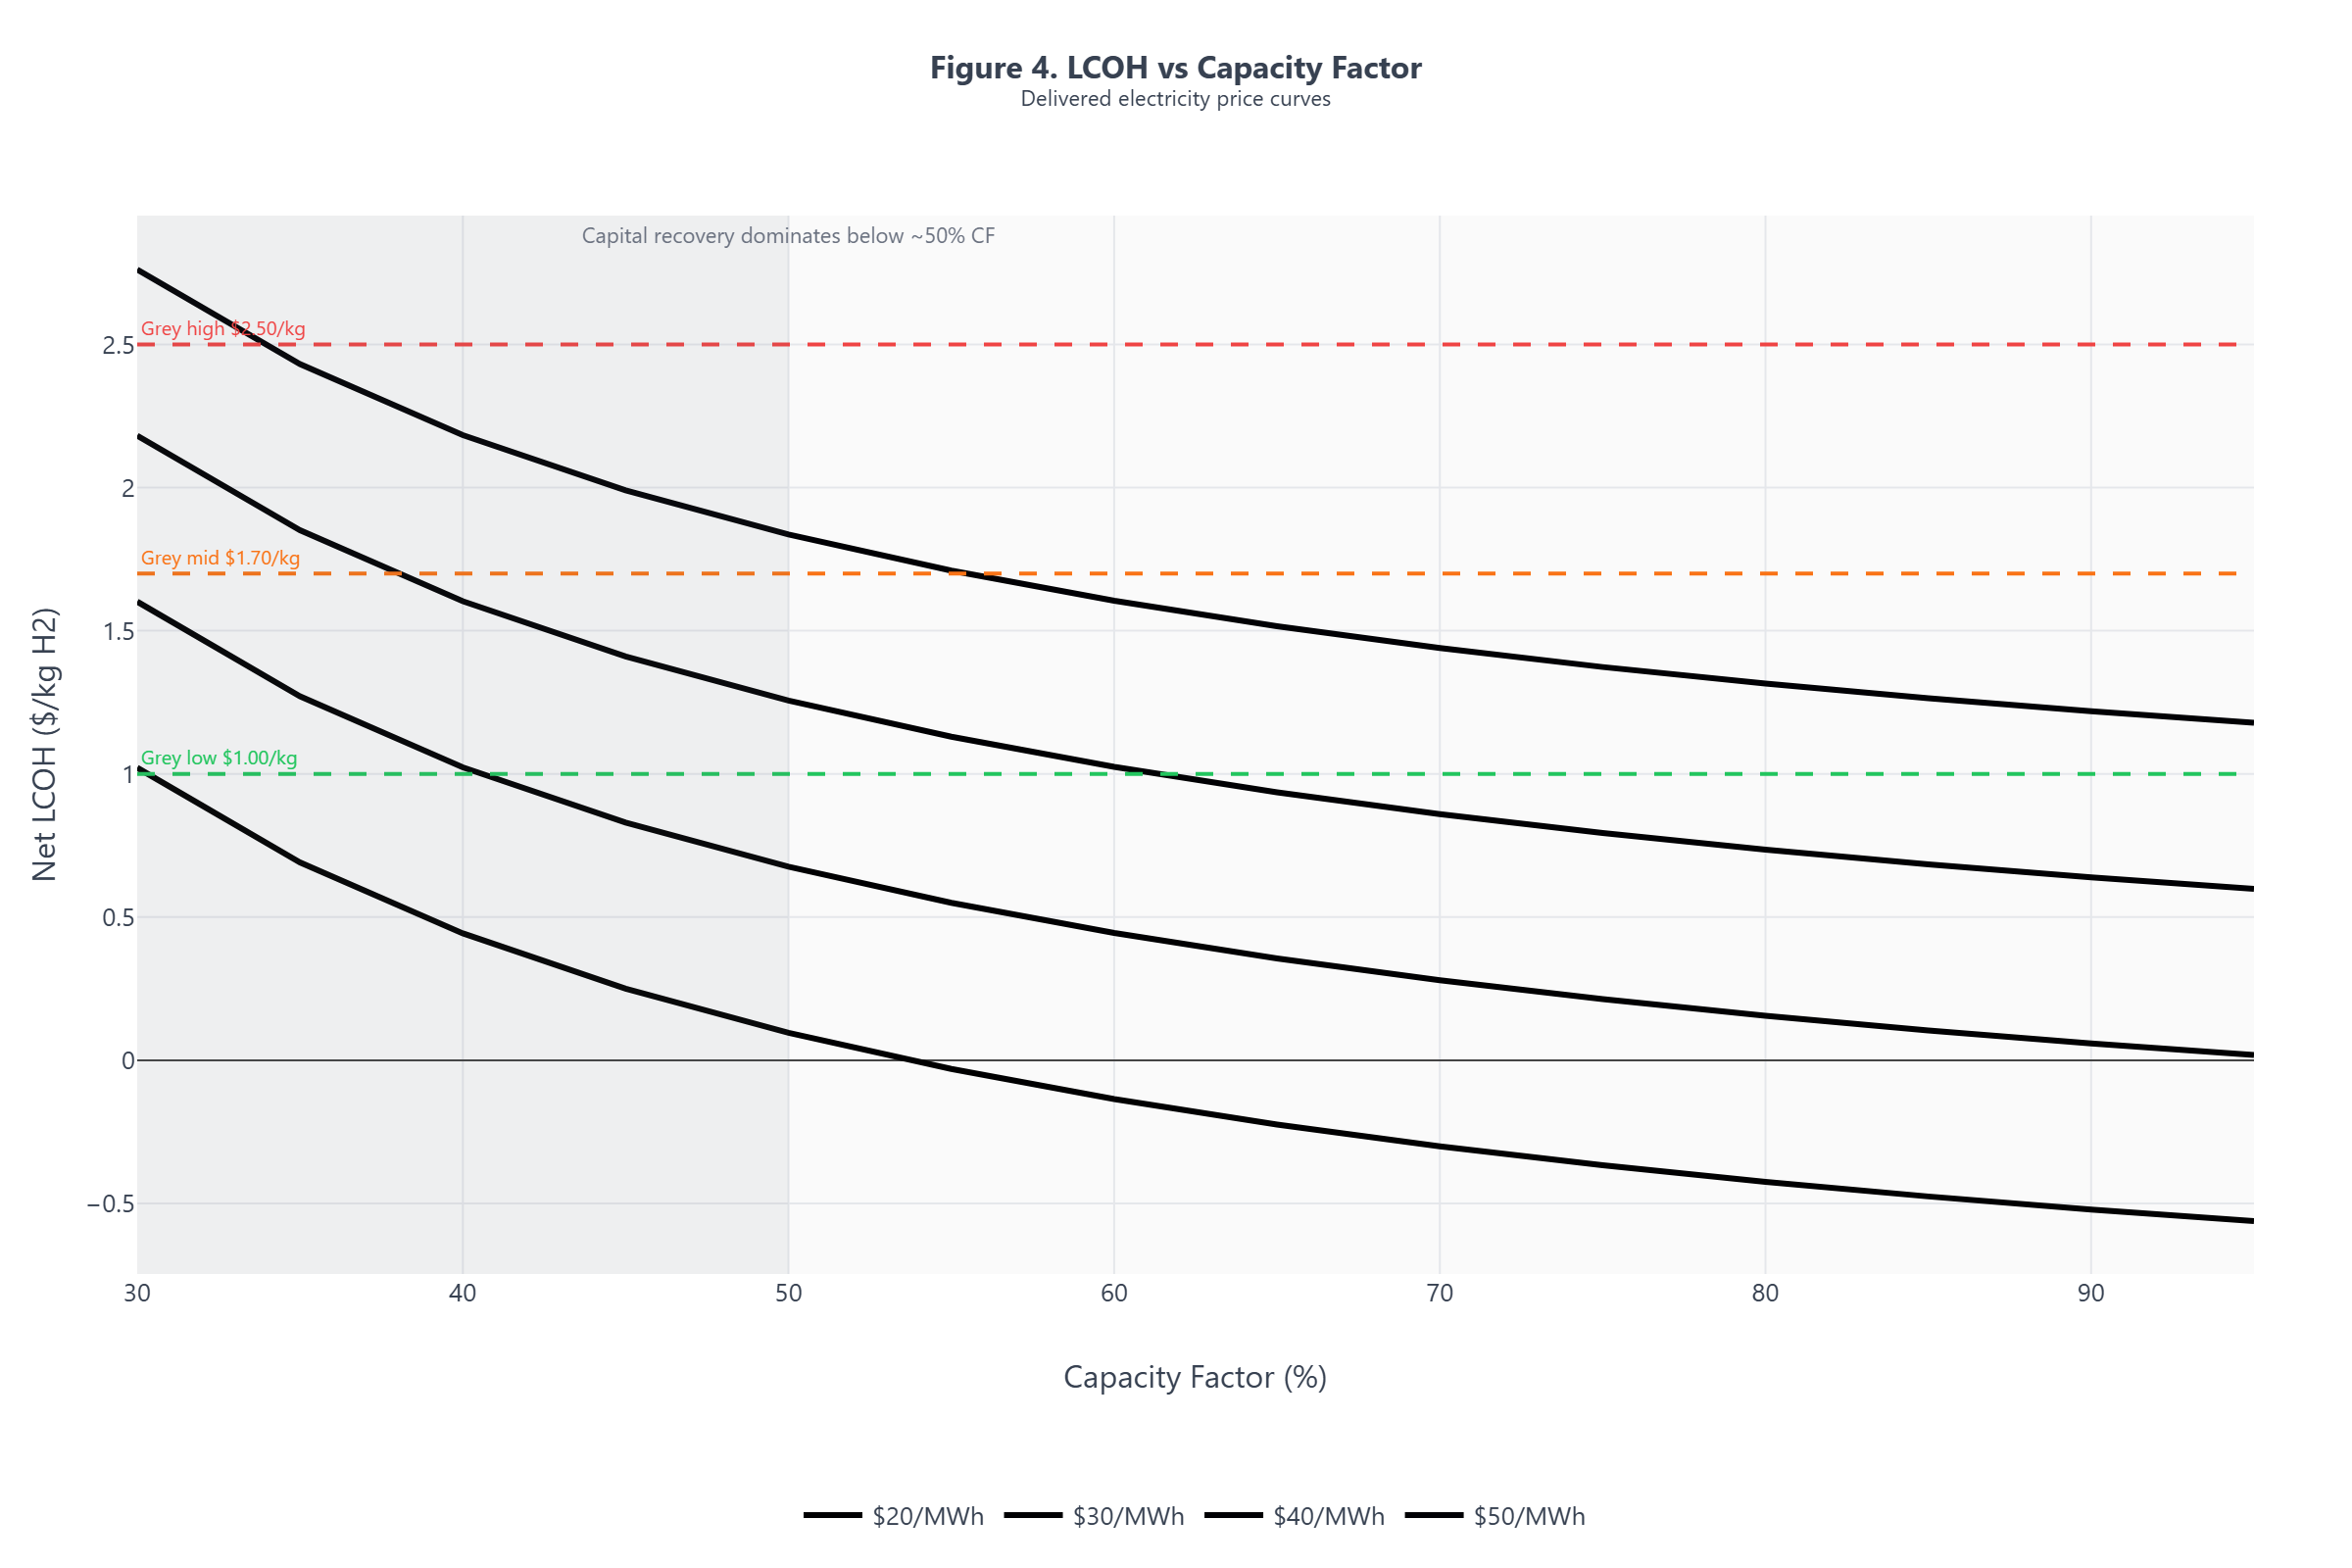
Figure 4 - LCOH vs Capacity Factor
Figure 4 shows how levelized hydrogen cost rises as capacity factor falls. Compare each curve with the grey-hydrogen benchmarks rather than the nominal electricity price alone.
Capital recovery dominance at low utilization
Figure 4: Capital recovery accelerates below approximately 60 percent CF and becomes severe below approximately 50 percent CF. In this region, parity erodes rapidly for mid/high benchmark bands even when nominal electricity prices appear competitive.
Key Takeaway
LCOH rises steeply below approximately 50 percent CF as capital recovery dominates the cost stack. A project at approximately 60 percent CF pays a capital penalty that cannot be offset by marginal electricity cost reductions.
Decision relevance: Use this curve to judge how far utilization can fall before parity breaks at each electricity price point.
Siting: Favor locations where utilization can be sustained at or above the viability threshold, not just where cheap power is advertised. Grid stability, curtailment history, and matching feasibility matter more than headline PPA price.
Procurement: Reliability and firming can dominate nominal price reductions. A procurement strategy that sacrifices utilization for low $/MWh may produce higher $/kg H2.
Design: Electrolyzer sizing should reflect realistic utilization based on procurement structure, not nameplate ambition or best-case availability assumptions.
Risk posture: Projects operating near utilization thresholds carry asymmetric downside risk. Small utilization losses near the cliff produce disproportionate cost impacts; margin is essential.
Decision Lens: When to Prioritize Utilization Over Price
Utilization should be weighted above electricity price in procurement and siting decisions when any of the following conditions apply:
1. The grid region has a high intermittency index (renewable penetration above 30 percent with limited dispatchable backup).
2. The PPA or procurement structure lacks firming capacity or minimum energy delivery guarantees.
3. The project's base-case CF falls below 60 percent, placing it in the nonlinear cost sensitivity zone.
4. Investors or lenders require downside protection against utilization variance exceeding 10 percentage points from the base case.
5. The applicable matching regime is hourly (post-2028) and the primary electricity source is a single intermittent resource.
If two or more conditions apply, the project should be evaluated on utilization-adjusted LCOH rather than nominal electricity cost. If three or more apply, utilization risk is the dominant feasibility constraint.
Project finance interactions
Utilization risk does not stay inside the cost model. It propagates into financing terms, contract structure, and risk allocation.
Cost of capital. Lenders and equity investors price utilization uncertainty into the weighted average cost of capital. Projects with uncontracted or weather-dependent CF face higher discount rates, which further increase levelized capital recovery and tighten the parity window. A project that models 8 percent WACC but faces 10-12 percent due to utilization risk may lose 15-25 percent of its apparent cost margin before operations begin.
PPA design. Procurement contracts that prioritize low headline price without CF guarantees transfer utilization risk from the power seller to the hydrogen project. Effective PPA structures for hydrogen should include minimum annual energy delivery obligations, curtailment compensation mechanisms, and utilization floor commitments. Without these, the PPA price is not the delivered cost.
Contractual risk mitigants. The following contract features directly address utilization risk:
Capacity factor floors in offtake or PPA agreements that guarantee minimum operating hours
Take-or-pay structures with the power supplier that align incentives around delivery, not just availability
Firming obligations that require the electricity provider to backstop intermittency gaps
Utilization-indexed pricing in hydrogen offtake agreements that adjust delivery commitments to realized CF
Projects that lack these structural protections carry utilization risk as unhedged exposure. Diligence should verify that contract terms match the utilization assumptions in the cost model.
Reference
7. Scope & Boundaries
Boundary statements (scope gate):
Geography/market: United States; 45V-eligible clean hydrogen markets.
System boundary: Delivered-to-user gate cost parity (not plant fence, not policy-adjusted averages).
Time boundary: Commercial year 2026 with 45V policy vintage valid as of February 2026.
Analytical scope (excluded disciplines): No legal interpretation, certification advice, detailed process engineering/design, permitting, or grid-dispatch modeling.
Baseline definition: Grey hydrogen comparators defined by low/mid/high delivered cost benchmarks (see Appendix A). Grey low (~$1.00/kg), mid (~$1.70/kg), high (~$2.50/kg).
7.1 Key modeling assumptions
Parameter
Base Assumption
Variation Tested
Delivered electricity price
Baseline effective ~$67/MWh (from $55/MWh nominal plus strategy adders/losses)
Nominal sweep: $25-$110/MWh; effective price translated per strategy
Capacity factor
50-80% (strategy-dependent)
Range: 30-95%
Energy storage
Not included in base case
Firmed renewable scenario includes round-trip losses
Firming contracts
Modeled as procurement scenario, not endogenous
Firm power scenario assumes contracted CF at higher $/MWh
Storage and firming are treated as procurement strategy features that affect both delivered electricity cost and realized utilization, not as separate cost line items. See Appendix A for full parameter specifications.
Interpretation guardrails: Forward-looking inputs are scenario assumptions, not predictions. This brief is an economic parity analysis; it is not legal advice, not a project certification, and not a forward price forecast.
Reference
8. Limitations & Critiques
Utilization modeled as scenario-driven, not dispatch-optimized. The analysis treats capacity factor as an input scenario rather than an endogenously optimized dispatch outcome. Real projects may have more or less utilization flexibility than modeled.
No endogenous electricity price feedback. Electricity prices are treated as exogenous inputs. Large-scale hydrogen deployment could affect regional electricity prices, which is not captured.
Credit rules applied mechanically, not legally interpreted. 45V eligibility and tier boundaries are modeled based on published Treasury guidance but do not constitute legal interpretation.
Grey benchmark uncertainty. Grey hydrogen costs vary by region, time, and natural gas price. The low/mid/high bands are reference cases, not predictions.
Uncertainty treatment is screening-level, not probabilistic. This note now reports threshold envelopes and stress cases, but does not run a full Monte Carlo confidence distribution for cliff location.
Response / Mitigations. Results are intended to bound feasibility and inform early-stage decisions, not replace project-specific diligence. Stress-test utilization assumptions and grey benchmarks for site-specific contexts.
Fragility
9. Stress Scenarios (Beyond Base Case)
The base-case analysis holds several inputs constant that may shift materially in practice. Projects should stress-test parity under the following scenarios:
Discount-rate stress (finance realism) - Base maps use 7% real to stay benchmark-aligned, but financing for utilization-exposed projects can clear at 10-12% real. Holding all else constant, the CAPEX carrying term increases as follows:
WACC (real)
Delta LCOH vs 7% at 75% CF ($/kg)
Equivalent electricity-price shift ($/MWh)
10%
+0.18
+3.3
12%
+0.31
+5.6
At lower CF (for example 50-60%), these uplifts are larger. This is why utilization risk and financing risk should be stress-tested together, not sequentially.
Grey benchmark volatility - The $1.70/kg mid-case assumes stable natural gas prices around $3-4/MMBtu. At $6/MMBtu (winter spike or sustained tightness), grey hydrogen rises to $2.00-2.50/kg, expanding the clean parity window. At $2/MMBtu (oversupply), grey falls to $1.00-1.20/kg, collapsing it. Forward gas curves and regional basis differentials should inform benchmark stress tests.
REC/EAC pricing risk - Clean energy attribute certificates may trade at premiums that increase effective delivered electricity cost beyond nominal PPA + adders. If hourly-matched RECs command $5-10/MWh premiums in tight markets, effective electricity cost rises accordingly.
Congestion and curtailment - Grid congestion in renewable-heavy regions (ERCOT West, CAISO shoulder hours) can force negative pricing or curtailment. While negative prices reduce nominal cost, curtailment directly reduces utilization, potentially more than offsetting the price benefit.
Interconnection-driven CF risk - Projects dependent on new generation may face interconnection delays, reducing expected utilization in early operating years. A 12-24 month delay in co-located solar/wind COD compresses the economic window for credit capture.
Stress Test Guidance
Re-run parity thresholds under: (1) grey benchmark at $1.00 and $2.50/kg, (2) REC adders of $5-10/MWh, (3) utilization reduced 10-15 percentage points from base case. If parity survives all three, the project has structural margin.
Reference
10. Regional Mapping (Illustrative)
Utilization risk varies materially by ISO/RTO due to differences in renewable penetration, congestion patterns, and matching feasibility:
ERCOT - High solar/wind penetration creates frequent negative pricing windows but also curtailment risk. West Texas projects face transmission constraints that can suppress realized CF despite abundant renewable resource. Hourly matching feasibility is high but utilization may be weather-limited to 40-55% for solar-only configurations.
CAISO - Duck curve dynamics create midday oversupply and evening ramps. Storage-backed firming is increasingly necessary to maintain utilization through evening hours. Projects without firming may see CF compressed to 35-45% under hourly matching despite access to low-cost midday solar.
PJM - Lower renewable penetration means less negative pricing but also less access to cheap clean power. Projects may need to rely on grid power with higher carbon intensity, pushing toward credit-tier boundaries. Firm nuclear-backed configurations may achieve higher CF (70-85%) but at higher delivered electricity cost.
Region
Typical CF Range (Hourly Matched)
Primary Utilization Risk
Firming Requirement
ERCOT
40-55%
Curtailment, transmission
Moderate
CAISO
35-45%
Duck curve, evening ramp
High
PJM
50-65%
Limited cheap clean supply
Low-Moderate
Regional estimates are illustrative and depend on specific project configuration, interconnection point, and procurement structure.
Method
11. Methods & Traceability (Analytical Lens)
This note applies a techno-economic parity lens using representative model runs from the Insight Quantix analysis engine. Key features of the lens:
Comparison at the user gate (not plant fence, not policy-adjusted averages)
Explicit modeling of:
Electrolyzer utilization (capacity factor) as primary driver
Delivered electricity price including adders and losses
Capital recovery amplification under reduced operating hours
45V credit value under tier proximity
Grey hydrogen modeled as a delivered cost benchmark, not a theoretical SMR minimum
Scenario vs sensitivity treatment: Procurement strategy and grey benchmark are discrete scenarios; electricity price and capacity factor are sensitivities within each scenario.
Results reflect parametric sweeps across the stated ranges, filtered to illustrate utilization-driven parity boundaries and cliff behaviors. Results are illustrative of economic boundaries, not exhaustive optimization.
Method
12. Appendix A: Modeling Parameters
Procurement Strategy Configurations
Strategy
Adders ($/kWh)
Loss Fraction
Utilization Impact
Basis
Intermittent, annual matched
$0.005
3%
CF reduced by matching constraints
PPA shaping + scheduling
Intermittent, hourly matched
$0.010
3%
CF further reduced by hourly compliance
Intra-hour balancing
Firm power (grid or firmed renewable)
$0.020
5%
CF sustained at contracted level
Firming + round-trip losses
Adders reflect incremental procurement costs beyond nominal PPA price. Loss fractions represent transmission, conversion, and utilization inefficiencies.
Scenario vs Sensitivity Classification
Input group
Treatment
Notes
Procurement strategy
Scenario
Discrete regimes (intermittent/firm/hybrid)
Electrolyzer type
Scenario
PEM vs alkaline
Grey benchmark band
Scenario (reference case)
Low/mid/high delivered cost cases
Electricity price
Sensitivity
Continuous sweep within each scenario
Capacity factor
Sensitivity
Continuous sweep within each scenario
Grey Hydrogen Benchmarks (delivered cost)
Benchmark
Cost ($/kg H2)
Description
Low
$1.00
Low-cost SMR with ~$3.00/MMBtu natural gas, no carbon capture (U.S. Gulf Coast baseline)
Mid
$1.70
U.S. industrial average delivered cost, 2024-2025
High
$2.50
Merchant delivered, non-captive, or high-natural-gas-price regions
Sources: DOE Hydrogen Program Records, IEA Global Hydrogen Review. Grey benchmarks are reference cases, not forecasts; treated as scenario variants.
Analysis Engine Configuration
Parameter
Value
Base Credit (Tier 1)
$3.00/kg H2
Electricity price range
$0.025-$0.110/kWh (nominal, pre-adders)
Capacity factor range
30%-95%
Electrolyzer configurations
PEM (55 kWh/kg) and alkaline (50 kWh/kg)
Reference CAPEX block
$300 million benchmark CAPEX (H2A reference block)
Annualized CAPEX at base WACC
$24.18 million/yr (7% real, 30y)
Non-electric OPEX
$0.548/kg
Stack replacement convention
80,000 operating hours; replacement treated in OPEX stress assumptions
Economic framework
ASTM E3200-compliant TEA
Discount rate
7% real base case; 10% and 12% stress cases
Project lifetime
30 years
All analyses conform to benchmark-anchored validation protocols as described in Insight Quantix TEA-LCA Engine documentation.
Reference
13. Appendix B: Policy Compliance Mapping
13.1 45V Strategy-to-Constraint Matrix
Procurement Strategy
Additionality
Deliverability
Temporal Matching
CF
Credit Risk
Co-located solar (new build)
Satisfied
On-site
Hourly: limited to solar hours
25-40%
Low
Co-located wind (new build)
Satisfied
On-site
Hourly: limited to wind availability
35-50%
Low
Solar + wind hybrid (new build)
Satisfied
On-site
Hourly: complementary profiles
45-60%
Low
PPA with hourly RECs
Depends on vintage
Same region
Hourly: REC timestamp must match
40-55%
Moderate
PPA with annual matching
Depends on vintage
Same region
Annual: higher CF achievable
60-80%
Higher (post-2027 phase-out)
Firmed renewable (storage-backed)
Satisfied
Satisfied
Hourly: storage enables load-following
70-90%
Low
Grid power (low-CI region)
Not satisfied
N/A
N/A
85-95%
High (may fail Tier 1)
13.2 Policy Parameter Sensitivity
Parity thresholds in this analysis assume current 45V rules. Key policy parameters that would shift thresholds if changed:
Policy Parameter
Current Assumption
If Relaxed
If Tightened
Temporal matching
Hourly (post-2028)
Higher achievable CF, expanded parity band
N/A
Additionality window
36-month lookback
More existing capacity eligible
Narrower eligible supply
Deliverability definition
Same region/BA
Cross-regional RECs allowed
Stricter LMP-based test
Tier 1 threshold
<0.45 kg CO2e/kg H2
Higher allowed intensity
Narrower pathway
Policy rules valid as of February 2026. Treasury guidance updates may materially alter thresholds.
Inputs table: Appendix A (benchmarks + author assumptions labeled; scenario vs sensitivity classified)
Reproducibility note: Parity boundaries are most sensitive to sustained utilization and procurement regime; changes to these inputs will shift decision regions. Conclusions flip primarily with CF assumptions.
Disclosure: Insight Quantix derived all analytical conclusions independently; references provide context only.
Policy validity: 45V rule interpretation valid as of February 2026 (updated through 2026-02-08 source pass).
Decision
15. Consequences
What must be proven
That the procurement structure can credibly deliver the narrow remaining viability conditions (for example, annual ~75% CF or hourly ~90% CF at nominal ~$25/MWh for grey-high edge cases). Not modeled. Not projected. Demonstrated or contractually guaranteed.
That utilization assumptions survive stress scenarios: curtailment, interconnection delay, weather variance, and matching-period misalignment.
That capital recovery arithmetic closes at the realized CF, not the nameplate CF or the developer's base case.
What should be discounted
Headline electricity prices that do not account for matching constraints, firming costs, transmission losses, or utilization penalties.
Parity claims built on annual matching assumptions after the transition to hourly matching.
LCOH projections that treat capacity factor as a fixed input rather than a distribution with downside tail risk.
What should not be assumed
That cheap power guarantees cheap hydrogen. It does not. Without sufficient utilization for the prevailing delivered-price band, it cannot.
That the cost curve is smooth. It is not. There are cliffs near 60 percent CF where small utilization losses produce large cost jumps.
That intermittent strategies are viable without firming. Under hourly matching, they fail the utilization test in most configurations.
Questions and corrections
Questions about assumptions, source interpretation, or reproducibility can be sent to jamie@insightquantix.com.
This analysis applies the Decision-Grade Parity-Fragility Framework (DG-PFF), developed by Insight Quantix. This note identifies both parity conditions and the fragility thresholds under which those conditions fail.
Gomez, J. R. (2026). 45V Utilization Risk: When Cheap Power Breaks Clean Hydrogen Parity (Insight Quantix Analytical Note IQ-AN-H2-2026-02, v2.0). Retrieved from https://insightquantix.com/45v-utilization-risk.html
Chicago Format
Gomez, Jamie R. "45V Utilization Risk: When Cheap Power Breaks Clean Hydrogen Parity." Insight Quantix Analytical Note IQ-AN-H2-2026-02, v2.0, June 19, 2026. https://insightquantix.com/45v-utilization-risk.html.
BibTeX
@techreport{Gomez2026_H2_Utilization,
  author = {Gomez, Jamie R.},
  title = {45V Utilization Risk: When Cheap Power Breaks Clean Hydrogen Parity},
  institution = {Insight Quantix},
  year = {2026},
  type = {Analytical Note},
  number = {IQ-AN-H2-2026-02},
  month = jun,
  url = {https://insightquantix.com/45v-utilization-risk.html}
}
Reference
17. About the Author
Jamie R. Gomez, Ph.D.
Principal, Insight Quantix
Chemical engineer specializing in decision-grade techno-economic analysis (TEA) and life cycle assessment (LCA) for hydrogen, sustainable aviation fuels, and power-to-liquids pathways. She translates process-level engineering models into cost, emissions, and uncertainty insights that inform capital allocation and technology scale-up decisions. Her prior work has supported technology cost-target modeling, scale-up analysis, and decision-oriented TEA/LCA efforts across federally funded clean-energy programs, including collaborations with Sandia National Laboratories, the National Renewable Energy Laboratory, ARPA-E, and clean-energy companies. She holds a PhD in chemical engineering with research focused on electrochemical materials fabrication.
Insight Quantix publishes independent analytical work for transparency and decision clarity. The analysis examines benchmark-anchored, audit-defensible economic risk conditions relevant to capital allocation decisions in the $10M-$500M range.
Validation Methodology: ASTM E3200 | ISO 14040/14044 | NREL benchmark-anchored Engine Documentation: Available upon request Website:insightquantix.com
Legal Disclaimer This analytical note is provided for informational and educational purposes only and does not constitute investment advice, financial advice, engineering design recommendations, or legal interpretation of tax policy. Readers should conduct independent due diligence and consult qualified professionals before making capital allocation decisions. The analysis reflects representative scenarios based on stated modeling parameters and should not be construed as a guarantee of project performance or economic outcomes. Specific project economics require site-specific analysis accounting for local conditions, technology configurations, and regulatory environments. Insight Quantix makes no warranties, express or implied, regarding the accuracy, completeness, or reliability of this information for any particular purpose.