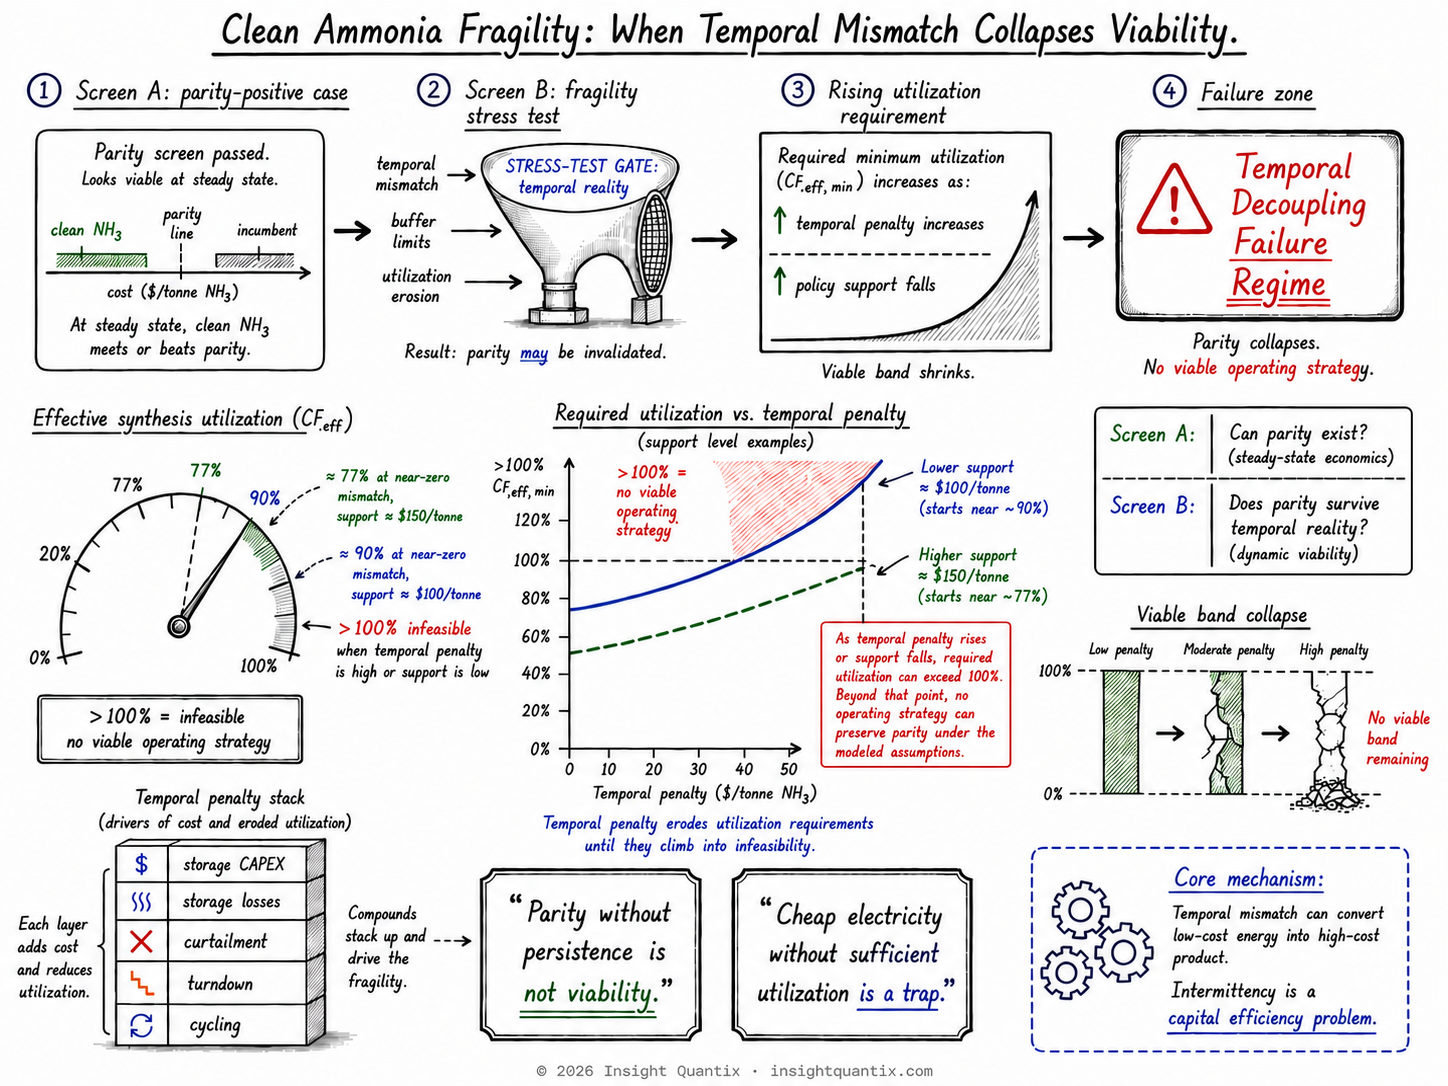
Clean Ammonia Fragility: When Temporal Mismatch Collapses Viability
Clean ammonia parity is not durable when temporal mismatch pushes required synthesis utilization beyond what the plant can physically sustain.
IQ-AN-NH3-2026-02 · 2026-04-08 · v1.0 · 11 min read
Plain-English takeaway
Passing a steady-state parity screen is only the starting point. As temporal mismatch grows or realized support falls, the minimum utilization needed to preserve parity rises. Once that requirement exceeds 100%, no operating strategy can preserve the modeled parity under the stated assumptions.
Why this matters
Decision-makers should not treat a parity-positive result as durable. The relevant test is whether required synthesis utilization remains physically achievable after temporal penalties and support uncertainty are applied. A model that requires more than 100% utilization is not fragile; it is infeasible.
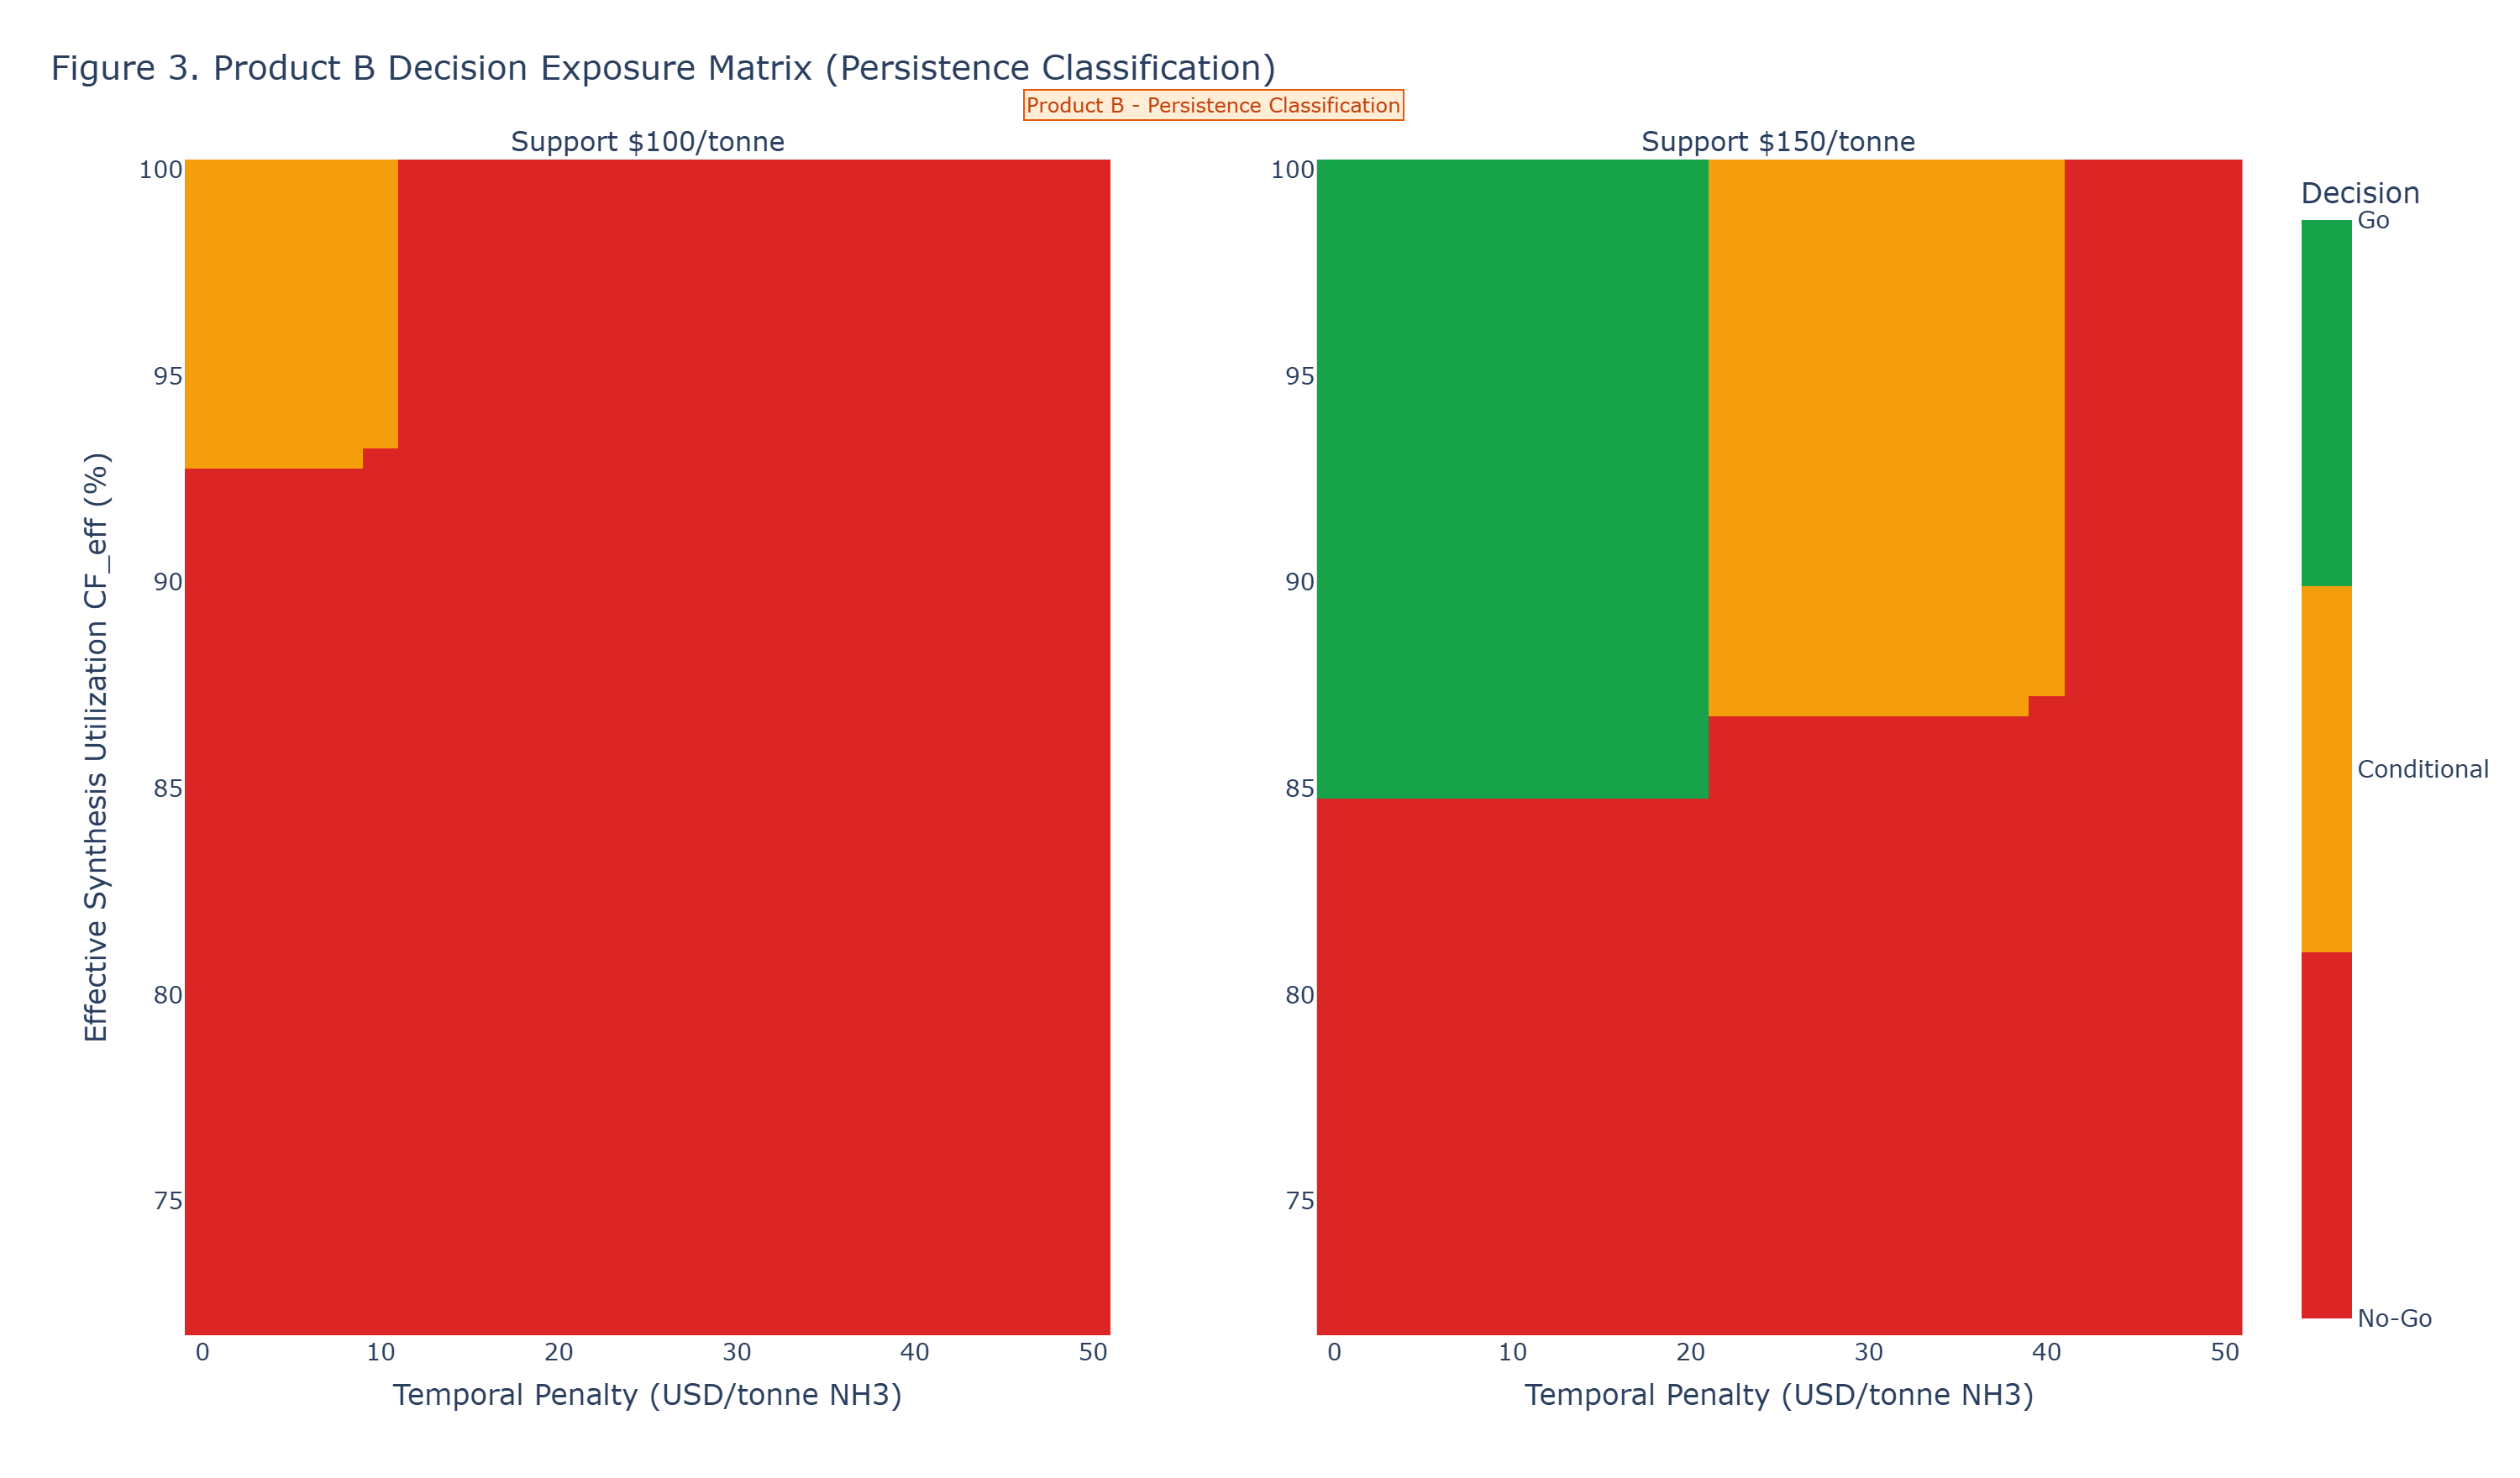
GO:CF_eff >= ~85%, temporal penalty <= ~$20/tonne, support >= ~$150/tonne.
CONDITIONAL: case remains at or above CF_eff_min = 270/(Benchmark + Policy_Credit - 450 - Temporal_Penalty).
NO-GO: any case below CF_eff_min, or temporal penalty > ~$40/tonne under <= ~$100/tonne support enters Temporal Decoupling Failure Regime.
Clean ammonia viability is governed by temporal alignment between hydrogen production and continuous synthesis demand. Below ~65% electrolyzer capacity factor, temporal mismatch forces either storage scaling or synthesis underutilization, both of which introduce compounding penalties. These penalties eliminate the apparent advantage of low-cost electricity and contract the viable region to a narrow band of high-utilization, partially firmed power conditions. This defines the Temporal Decoupling Failure Regime.
Temporal mismatch penalty: Storage, curtailment, cycling, and continuity costs push the utilization requirement upward.
Realized policy support: Lower support sharply narrows the viable operating band.
Delivered hydrogen cost: Higher hydrogen cost consumes the remaining margin available for temporal penalties.
Decision
Kill Conditions
The following conditions fail the persistence screen unless the operating structure changes:
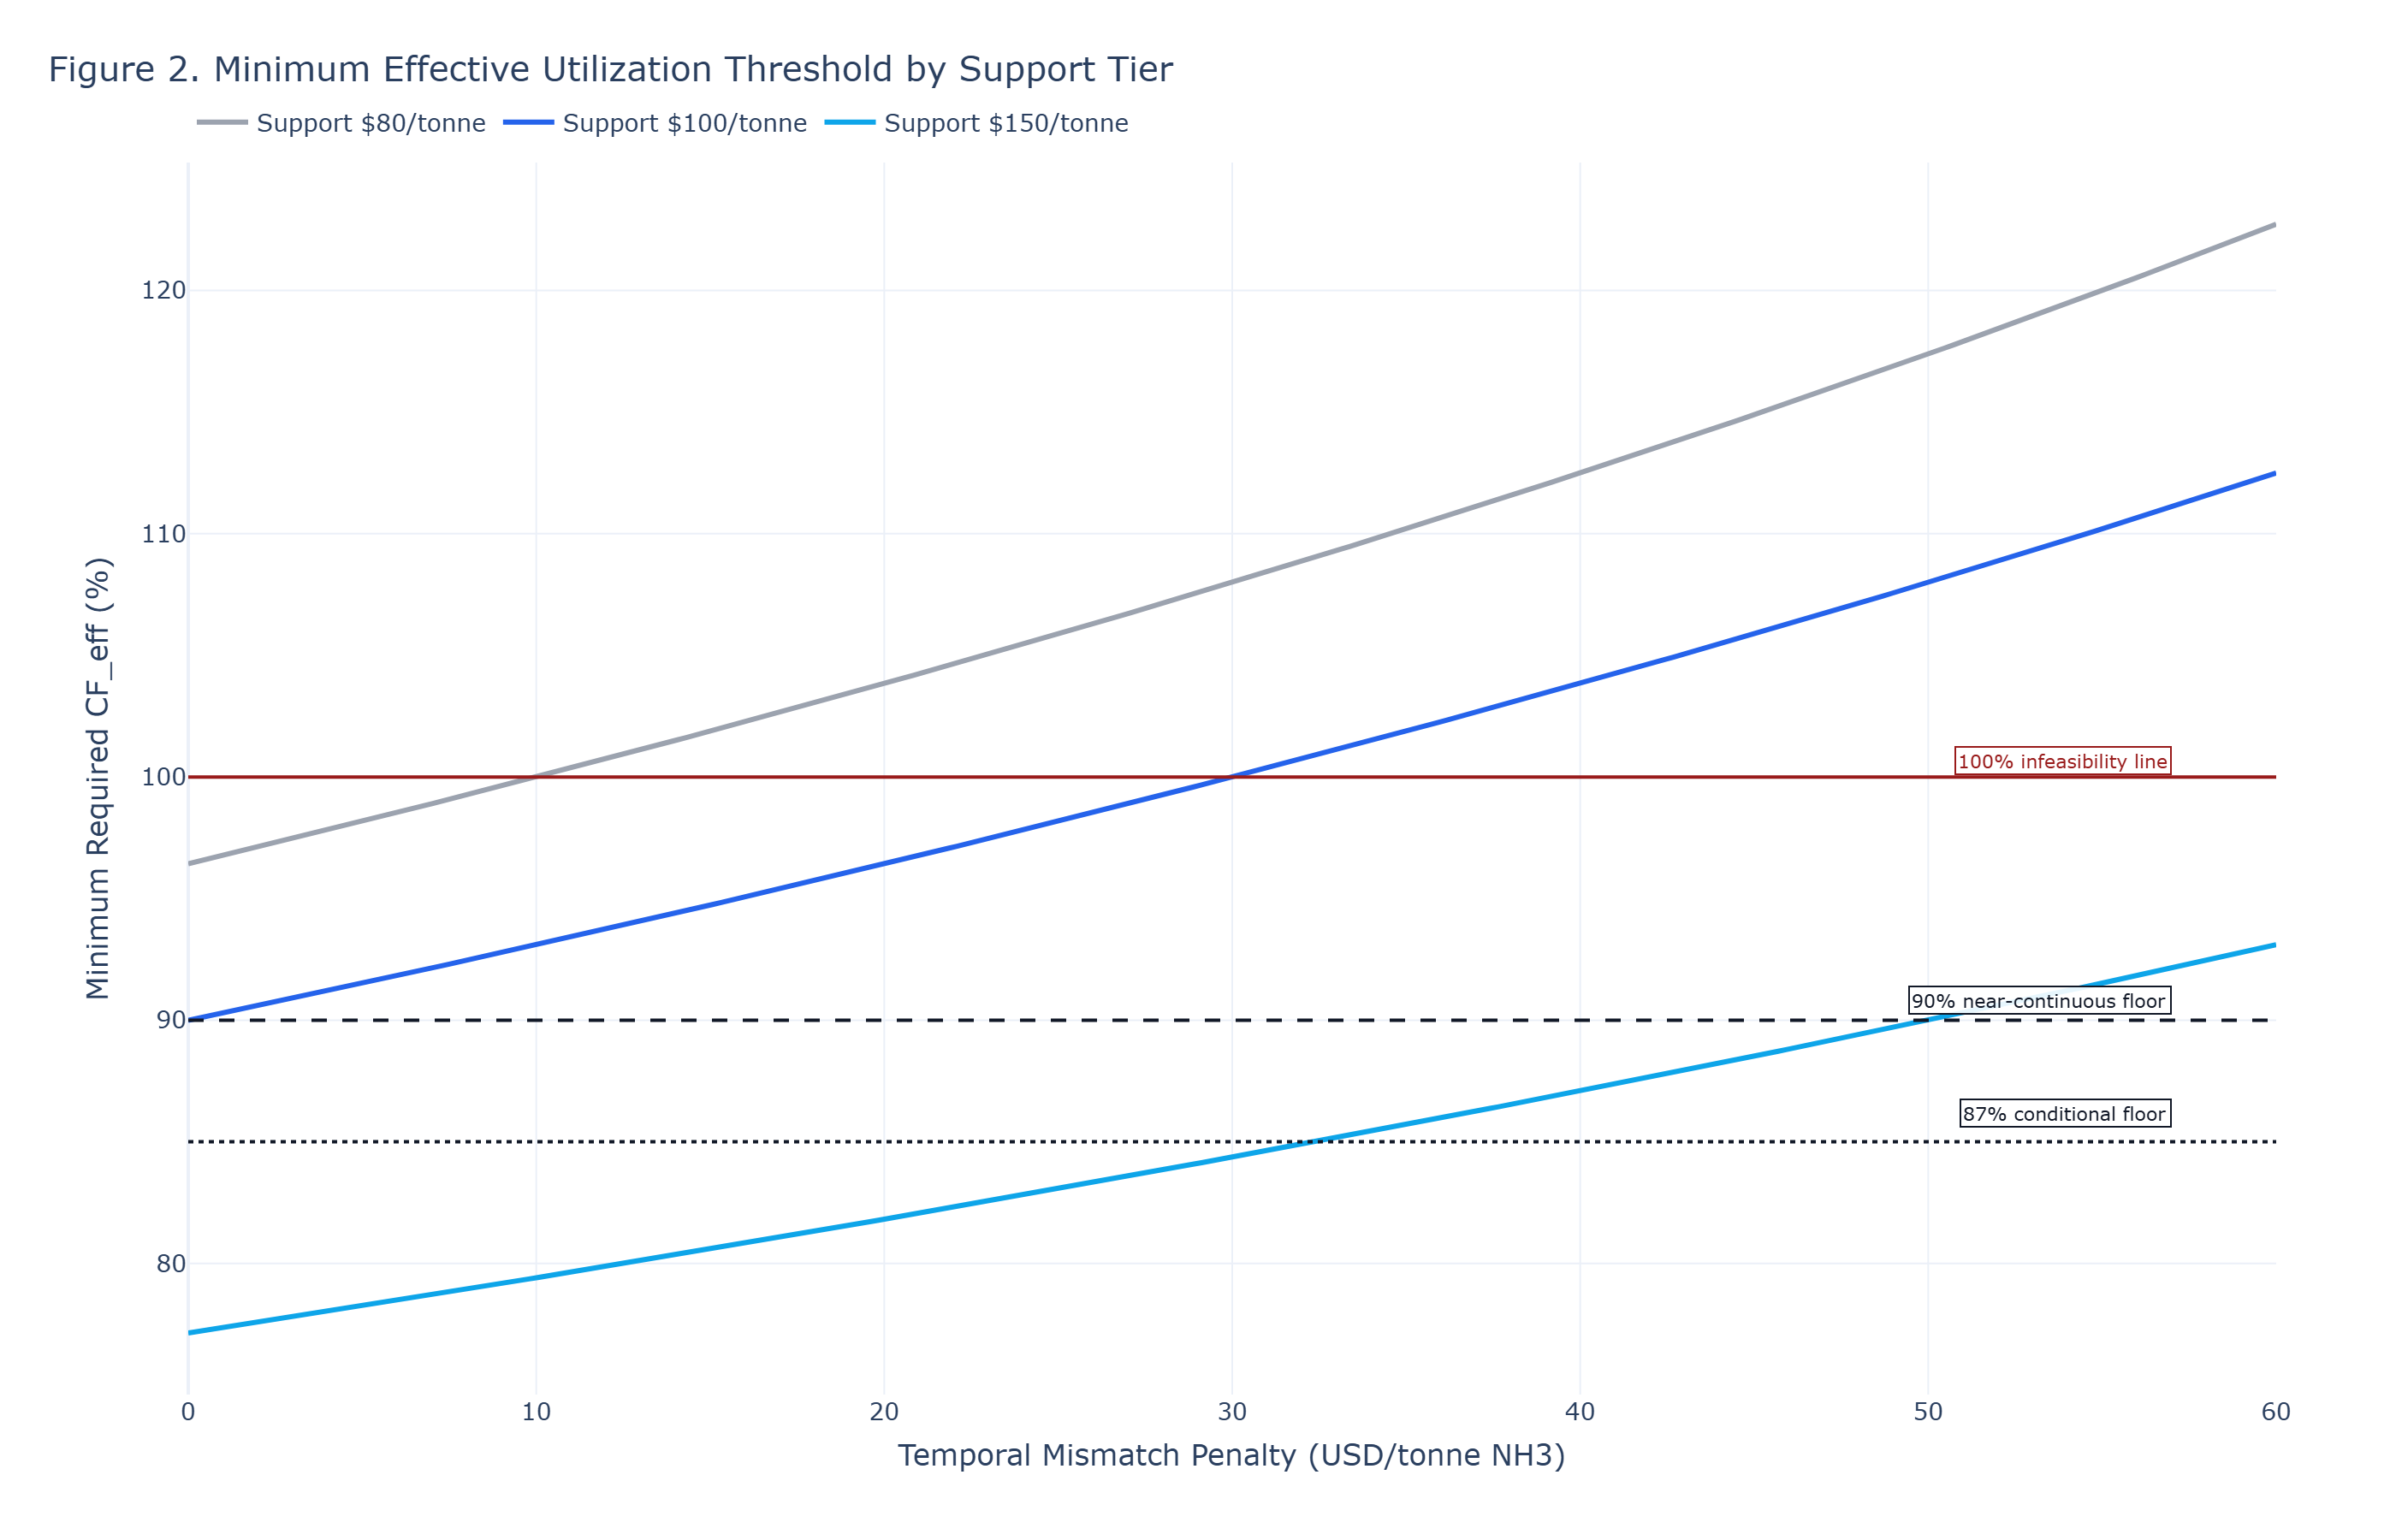
Effective synthesis utilization falls below the support-tier floor. At near-zero temporal penalty, persistence fails below roughly 77% utilization with approximately $150/tonne support and below roughly 90% with approximately $100/tonne support.
Temporal penalties push the required utilization above 100%. At approximately $100/tonne support and a $40/tonne temporal penalty, CF_eff_min reaches roughly 103.8%, making the operating requirement infeasible.
No credible buffer and dispatch architecture can sustain the required utilization. A parity-positive steady-state case does not survive if storage, curtailment, cycling, or continuity losses force the synthesis block below CF_eff_min.
Context
Technical Note (Audit Trail)
Context
1. Decision Context
This note is the persistence stress layer for the ammonia parity boundary defined in Product A. It determines whether parity survives temporal mismatch and utilization erosion under explicit support assumptions.
Method
2. Analytical Lens (DG-PFF)
Parity condition:Net LCOA_clean <= Benchmark_Ammonia (imported from Product A).
Fragility condition: persistence of parity under temporal penalty and utilization stress.
Decision principle: parity without persistence is not viability.
Fragility
3. Collapse Algebra
Using a deterministic decomposition consistent with current source-input baselines:
Benchmark ammonia assumption used in illustrative thresholds: ~$650/tonne on an import-dependent delivered basis (not US Gulf/Middle East normalized spot basis).
Policy_Credit represents realized support value (for example, 45V pass-through equivalent, LCFS-linked credit value, or bilateral contract premium).
Baseline clean ammonia anchor: ~$750/tonne
Approximate fixed-cost block at reference operation: F ~= $300/tonne
Approximate variable-cost block: V ~= $450/tonne (includes H2 fixed at central case ~$2.50/kg, i.e., 176 * 2.50 ~= $440/tonne, plus non-H2 variable costs)
Reference effective utilization: CF_ref = 0.90
Cost form:
Net LCOA_clean ~= V + F * (CF_ref / CF_eff) + Temporal_Penalty - Policy_Credit
             ~= 450 + 300 * (0.90 / CF_eff) + Temporal_Penalty - Policy_Credit
These penalties compound and scale nonlinearly with intermittency.
The dominant failure pathway is the combined rise of storage burden plus utilization dilution.
Under low/moderate support, this decomposition pushes CF_eff_min above feasible operating ranges.
Component mapping is anchored to ammonia_temporal_penalty_decomposition_template.csv and linked hourly profiles.
Fragility
4. Illustrative Collapse Outputs
Benchmark ~$650/tonne, support ~$150/tonne, temporal penalty ~$0/tonne:
CF_eff_min ~= 77.1%
Benchmark ~$650/tonne, support ~$100/tonne, temporal penalty ~$0/tonne:
CF_eff_min ~= 90.0%
Benchmark ~$650/tonne, support ~$100/tonne, temporal penalty ~$40/tonne:
CF_eff_min ~= 103.8%, indicating an infeasible utilization requirement and collapse under this setup.
Interpretation: Temporal penalties compound nonlinearly, collapsing the apparent parity region into a narrow or non-existent viable domain. Once temporal penalties are introduced, the viable region contracts to a narrow band of high-utilization, partially firmed power conditions.
Named failure mode: Temporal Decoupling Failure
Temporal Decoupling Failure occurs when temporal mismatch and utilization erosion push the minimum required synthesis utilization above what the system can physically sustain.
Decision rule: if CF_eff < CF_eff_min = 270 / (Benchmark_Ammonia + Policy_Credit - 450 - Temporal_Penalty), parity persistence fails. If CF_eff_min > 100%, no operating strategy is feasible under the stated assumptions.
Ammonia economics are not hydrogen economics. They are synchronization economics.
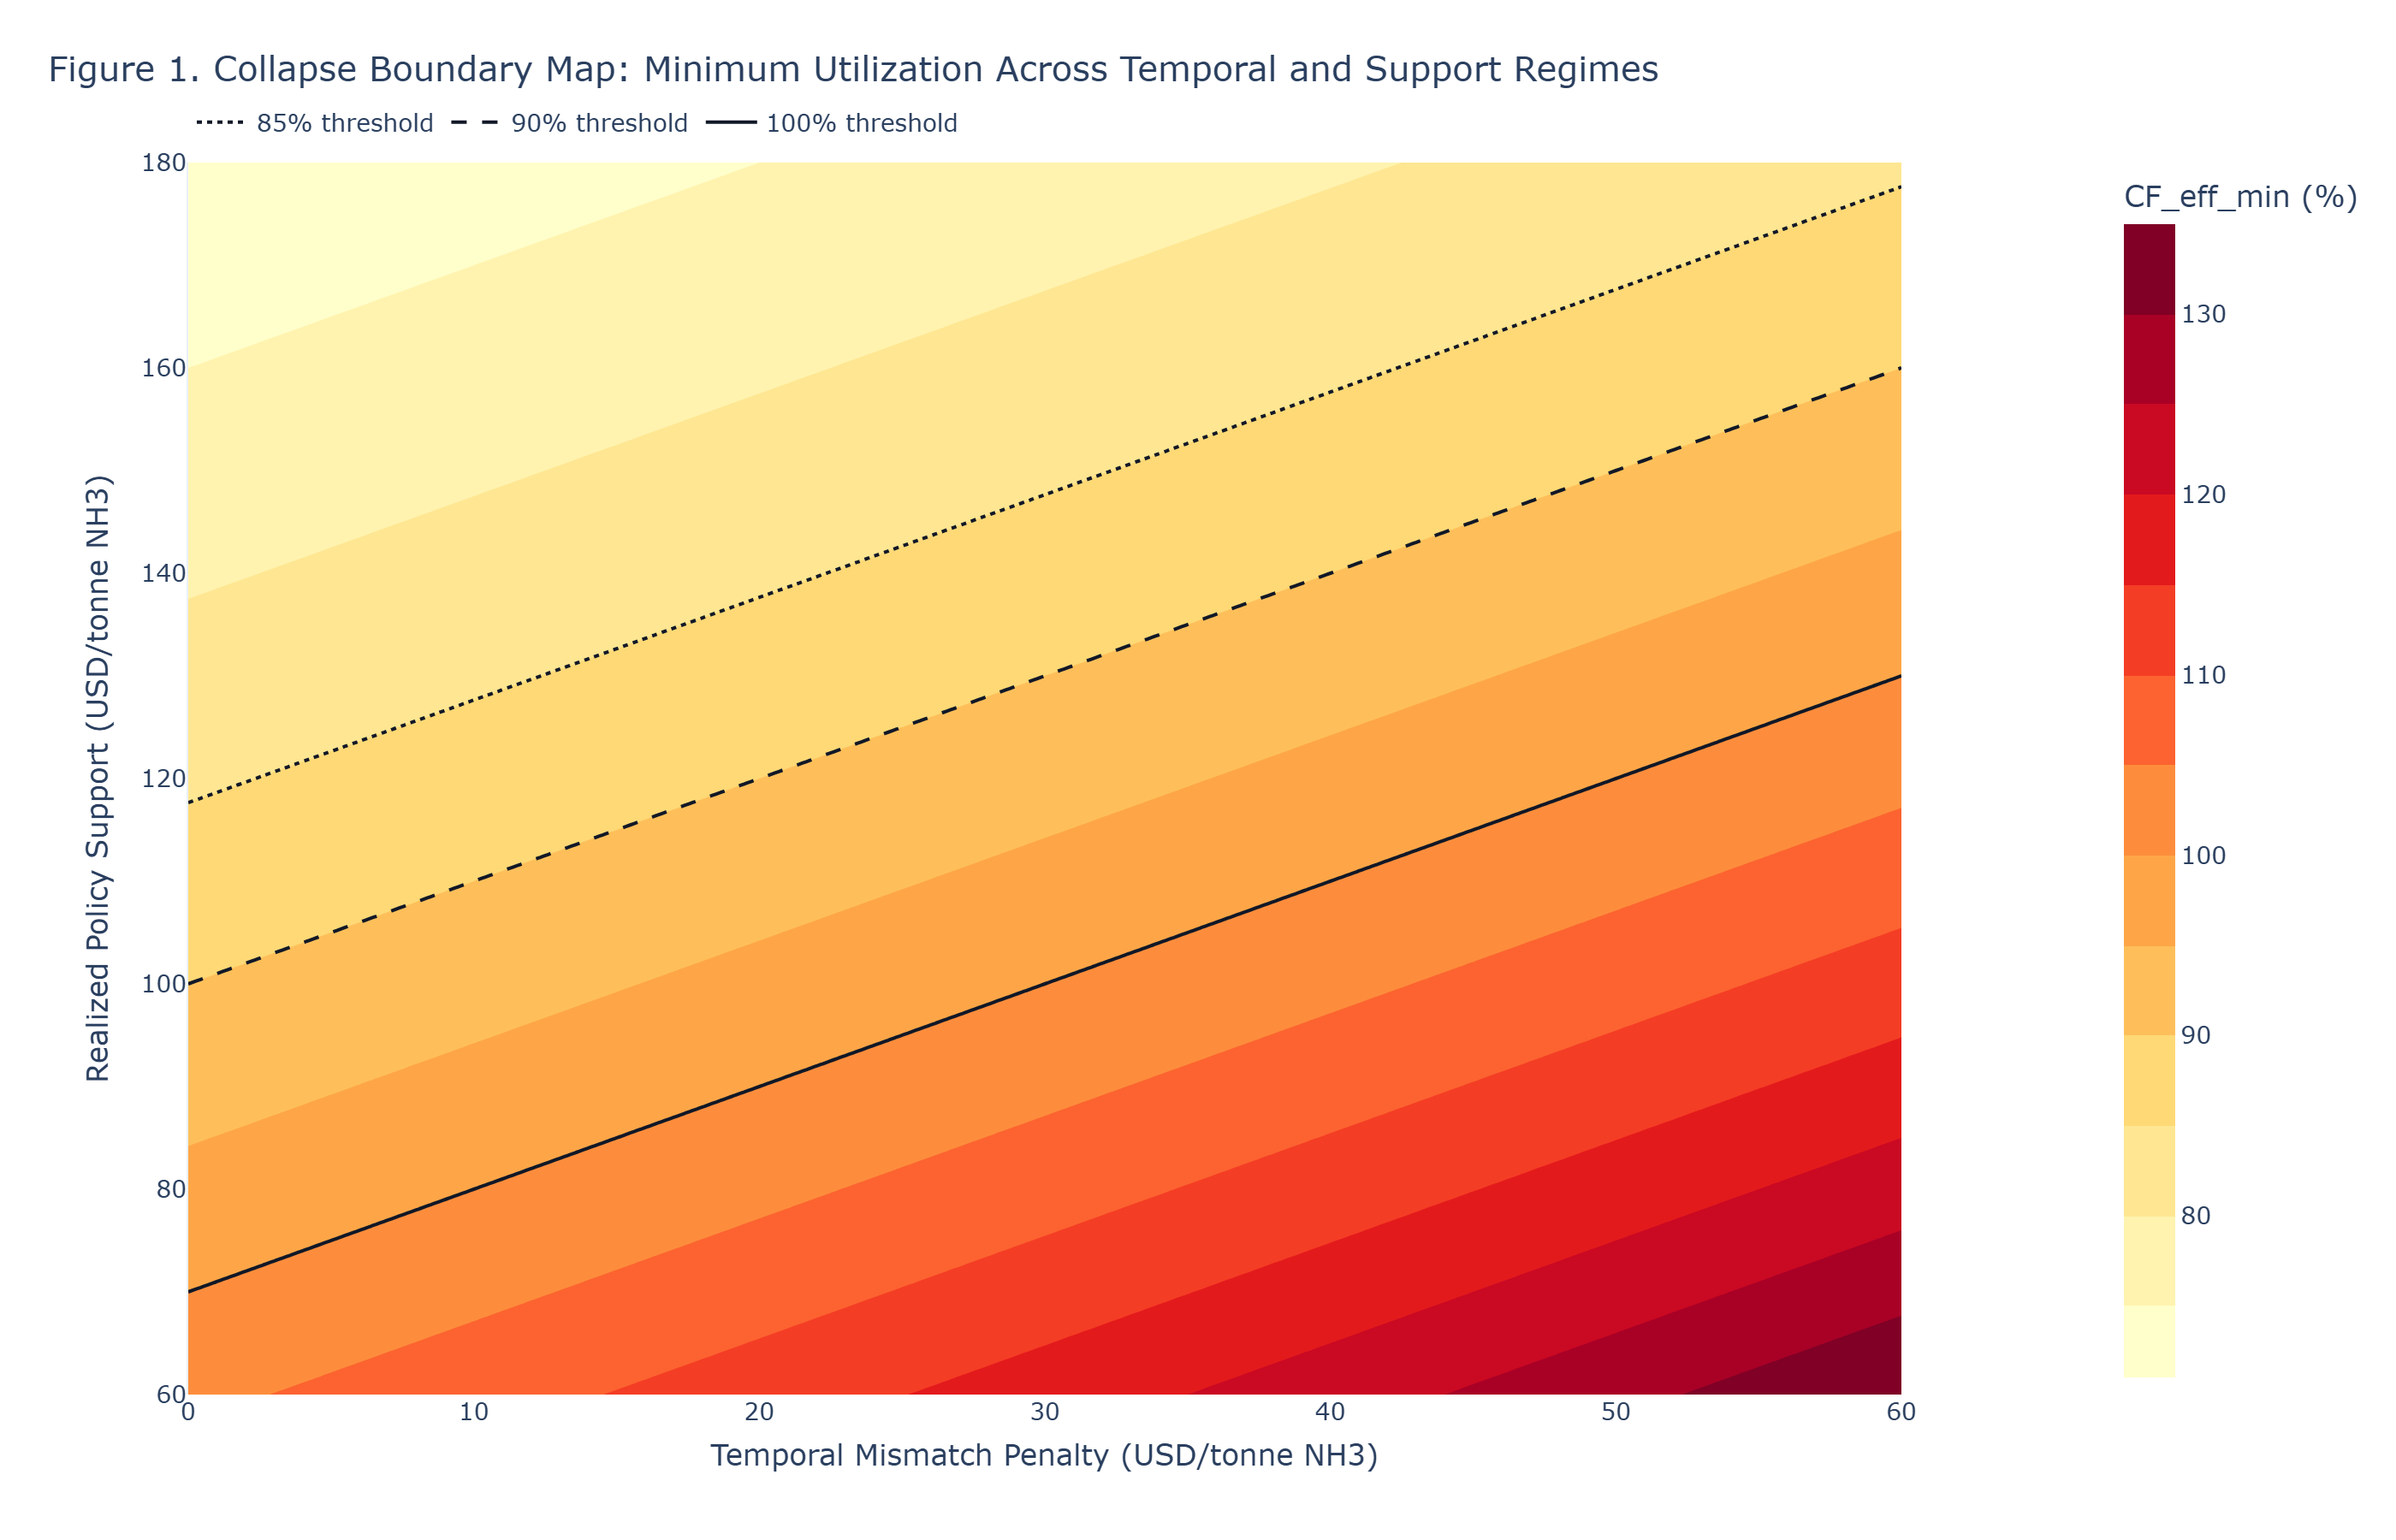
Figure 1 - Collapse Boundary Map
Figure 1 shows how the required utilization boundary rises as temporal mismatch penalties increase. Focus on where the boundary approaches or exceeds 100%: beyond that point, no operating strategy is feasible.
Figure 1: Collapse boundary map of utilization requirement versus temporal mismatch penalty across support tiers.
Decision statement
The persistence boundary rises sharply with penalty load under low/moderate support, collapsing apparent Product A headroom.
Figure 2 - Minimum Utilization by Support Tier
Figure 2 compares minimum utilization thresholds across support tiers. Lower realized support pushes the synthesis block toward near-continuous operation even at low mismatch.
Figure 2: CF_eff_min threshold curves by support tier and temporal-penalty regime.
Decision statement
Support-tier downgrades shift persistence requirements into near-continuous utilization regimes that are difficult to sustain operationally.
Figure 3 - Decision Exposure Matrix
Figure 3 translates utilization, temporal mismatch, and policy support into Go, Conditional Go, and No-Go exposure.
Figure 3: Go / Conditional Go / No-Go exposure classes under utilization, temporal mismatch, and support combinations.
Decision statement
Cases that appear parity-positive at steady state become No-Go when utilization and temporal constraints are treated as endogenous.
Context
5. Invalidation Link to Product A
This Product B note explicitly invalidates portions of Product A's parity-defined region by adding temporal mismatch and utilization stress. Cases that satisfy Product A at steady state may fail once CF_eff and temporal penalties are treated as endogenous outcomes. Product A answers where parity can exist; Product B enforces whether that region survives real operating constraints. Hydrogen-only parity regions assume synchronous utilization; ammonia synthesis introduces temporal constraints that collapse these regions once mismatch penalties rise. Projects that enter Temporal Decoupling Failure Regime should be classified as non-viable for capital allocation. In DG-PFF handling, this regime is a direct No-Go classification unless structure is redesigned.
Methodology disclosure: deterministic threshold algebra only; no cycling degradation model, and no stochastic persistence treatment in this release.
Reference
7. Scope and Limitations
Simplified fixed/variable decomposition for screening implementation.
Hour-resolved dispatch is represented through validated 8760 input profiles; full dynamic plant simulation remains out of scope.
Collapse thresholds are conditional on the central H2 value embedded in V; joint re-solving with Product A H2-cost variation is required for non-default H2 cases.
No project-specific storage degradation or compressor-cycle modeling yet.
Inputs and thresholds: See fragility thresholds and linked artifacts in assets/data/notes/clean-ammonia-fragility-temporal-mismatch-collapses-viability/.
Reproducibility note: Persistence boundaries are most sensitive to effective utilization, temporal-penalty decomposition, and policy-support realization tiers.
Disclosure: Insight Quantix derived all analytical conclusions independently; external references provide context only.
Reference
How to Cite This Analytical Note
APA Format
Gomez, J. R. (2026). Clean Ammonia Fragility: When Temporal Mismatch Collapses Viability (Insight Quantix Analytical Note IQ-AN-NH3-2026-02, v1.0). Retrieved from https://insightquantix.com/insights/clean-ammonia-fragility-temporal-mismatch-collapses-viability/
Chicago Format
Gomez, Jamie R. "Clean Ammonia Fragility: When Temporal Mismatch Collapses Viability." Insight Quantix Analytical Note IQ-AN-NH3-2026-02, v1.0, April 2026. https://insightquantix.com/insights/clean-ammonia-fragility-temporal-mismatch-collapses-viability/.
BibTeX
@techreport{Gomez2026_NH3_Fragility,
  author = {Gomez, Jamie R.},
  title = {Clean Ammonia Fragility: When Temporal Mismatch Collapses Viability},
  institution = {Insight Quantix},
  year = {2026},
  type = {Analytical Note},
  number = {IQ-AN-NH3-2026-02},
  month = apr,
  url = {https://insightquantix.com/insights/clean-ammonia-fragility-temporal-mismatch-collapses-viability/}
}
Method
Appendix A: Modeling Parameters
Model form: See the governing equations and threshold definitions in the technical section of this note.
Primary data artifacts:assets/data/notes/clean-ammonia-fragility-temporal-mismatch-collapses-viability/
Reproducibility scope: This appendix anchors file locations and parameter traceability for decision-grade review.
Reference
About the Author
Jamie R. Gomez, Ph.D.
Principal, Insight Quantix
Chemical engineer specializing in decision-grade techno-economic analysis (TEA) and life cycle assessment (LCA) for hydrogen, sustainable aviation fuels, and power-to-liquids pathways. She translates process-level engineering models into cost, emissions, and uncertainty insights that inform capital allocation and technology scale-up decisions. Her prior work has supported technology cost-target modeling, scale-up analysis, and decision-oriented TEA/LCA efforts across federally funded clean-energy programs, including collaborations with Sandia National Laboratories, the National Renewable Energy Laboratory, ARPA-E, and clean-energy companies. She holds a PhD in chemical engineering with research focused on electrochemical materials fabrication.
Insight Quantix publishes independent analytical work for transparency and decision clarity. The analysis examines benchmark-anchored, audit-defensible economic risk conditions relevant to capital allocation decisions in the $10M-$500M range.
Validation Methodology: ASTM E3200 | ISO 14040/14044 | NREL benchmark-anchored Engine Documentation: Available upon request Website:insightquantix.com
Legal Disclaimer This analytical note is provided for informational and educational purposes only and does not constitute investment advice, financial advice, engineering design recommendations, or legal interpretation of tax policy. Readers should conduct independent due diligence and consult qualified professionals before making capital allocation decisions. The analysis reflects representative scenarios based on stated modeling parameters and should not be construed as a guarantee of project performance or economic outcomes. Specific project economics require site-specific analysis accounting for local conditions, technology configurations, and regulatory environments. Insight Quantix makes no warranties, express or implied, regarding the accuracy, completeness, or reliability of this information for any particular purpose.