Clean Ammonia Cost Parity: When Intermittent Hydrogen Meets Continuous Synthesis
Why cheap hydrogen can still fail when ammonia synthesis cannot afford to wait.
IQ-AN-NH3-2026-01 · 2026-04-01 · v1.0 · 10 min read
Plain-English takeaway
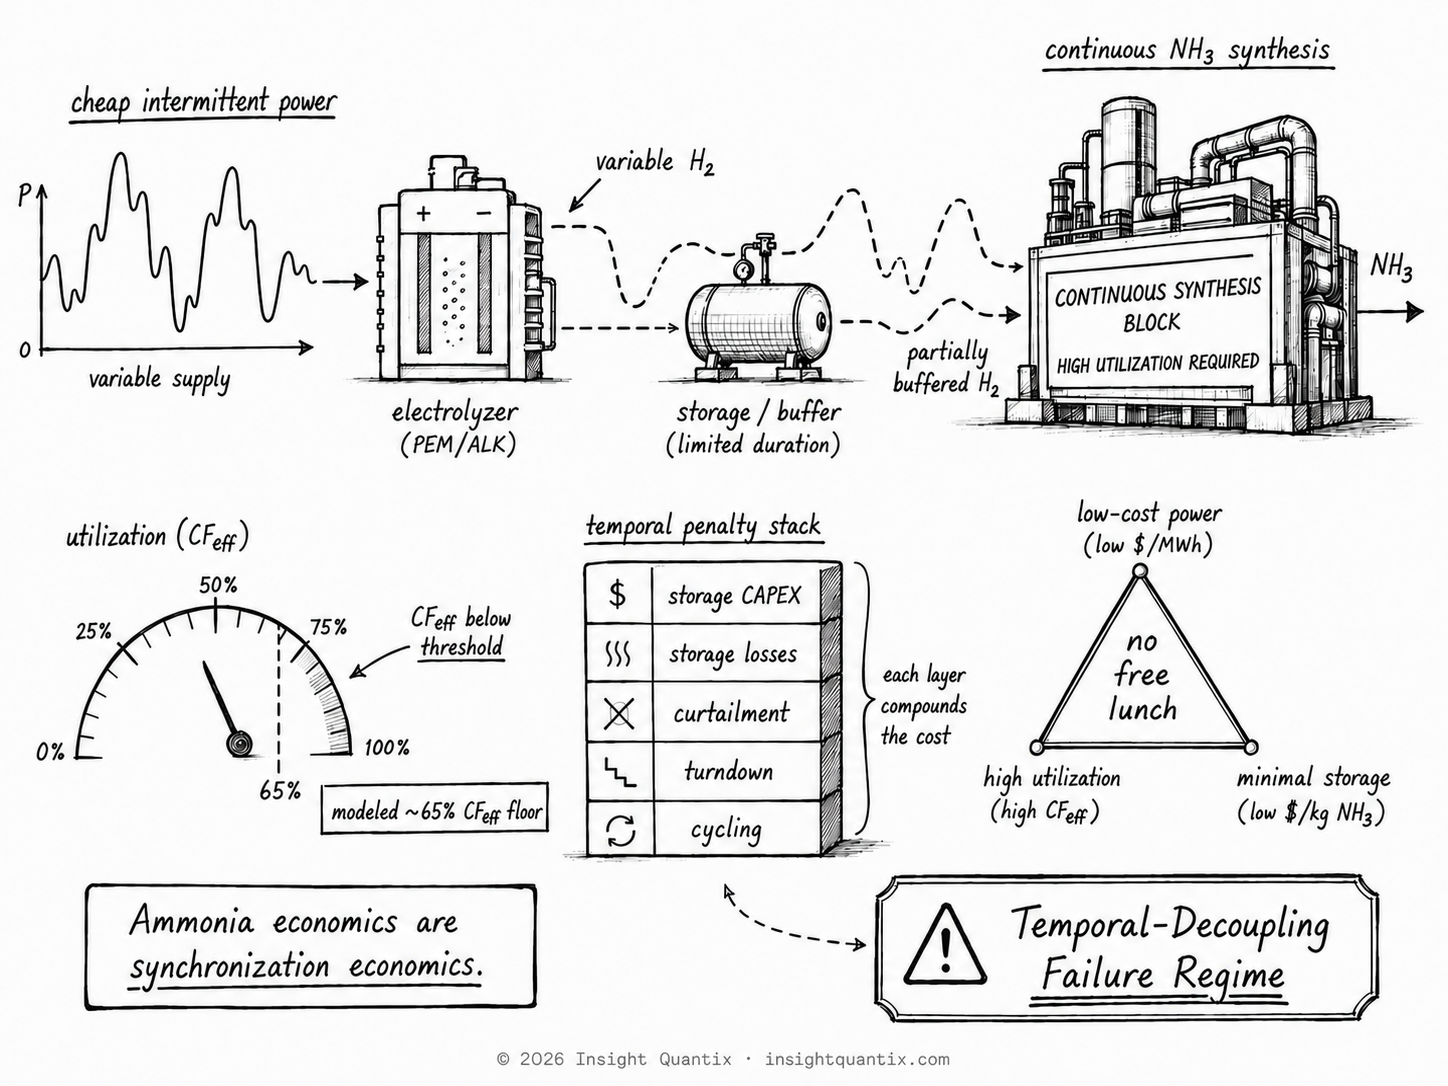
Cheap power is not enough. If hydrogen supply is intermittent, the ammonia plant needs enough storage to run steadily or it absorbs underutilization, cycling, curtailment, and storage penalties. Below roughly 65% effective utilization, those penalties can overwhelm the electricity-cost advantage.
Why this matters
A project developer, lender, or program reviewer should not evaluate clean ammonia using hydrogen cost alone. The decision turns on whether the project can keep the synthesis block sufficiently utilized while controlling temporal mismatch penalties. The project does not fail because hydrogen is impossible. It fails when the downstream plant cannot afford to wait.
GO:H2 <= ~$2.2/kg, temporal penalty <= ~$20/tonne, support >= ~$150/tonne.
CONDITIONAL: case remains on or below H2_cost_threshold = (Benchmark + Policy_Credit - 310 - Temporal_Penalty) / 176.
NO-GO: any case above threshold, temporal penalty > ~$50/tonne, or support <= ~$100/tonne with temporal penalty > ~$40/tonne enters Temporal Decoupling Failure Regime.
Clean ammonia viability is governed by temporal alignment between hydrogen production and continuous synthesis demand. Below ~65% electrolyzer capacity factor, temporal mismatch forces either storage scaling or synthesis underutilization, both of which introduce compounding penalties. These penalties eliminate the apparent advantage of low-cost electricity and contract the viable region to a narrow band of high-utilization, partially firmed power conditions. This defines the Temporal Decoupling Failure Regime.
What drives the result
Delivered hydrogen cost: Must remain below the model-implied parity threshold.
Policy support: Lower realized support materially tightens the allowable hydrogen-cost ceiling.
Effective utilization: Falling utilization spreads fixed synthesis capital across fewer tonnes of ammonia.
Decision
Kill Conditions
The following conditions fail the parity screen unless the operating or commercial structure changes:
Hydrogen cost exceeds the model-implied ceiling. At a benchmark of roughly $650/tonne, policy support of roughly $100/tonne, and a temporal penalty of roughly $50/tonne, the hydrogen-cost threshold tightens to approximately $2.22/kg.
Temporal penalties consume the remaining support margin. With policy support at or below roughly $100/tonne, penalties above roughly $40/tonne collapse much of the parity region; above roughly $50/tonne, central cases fail.
No credible near-continuous synthesis plan exists. If effective synthesis utilization cannot remain near the screening boundary, favorable hydrogen pricing does not preserve ammonia parity.
Context
Technical Note (Audit Trail)
Parity model form
This note decomposes clean ammonia cost using current source-validated baseline inputs:
Benchmark ammonia basis used in illustrative thresholds: ~$650/tonne on an import-dependent delivered basis (not US Gulf/Middle East normalized spot basis).
Policy_Credit represents realized support value (for example, 45V pass-through equivalent, LCFS-linked credit value, or bilateral contract premium).
Baseline clean ammonia cost anchor: ~$750/tonne.
Hydrogen contribution at defaults: 176 kg-H2/tonne * $2.50/kg = $440/tonne.
Reference non-hydrogen cost block at CF_eff ~= 0.90: ~$310/tonne; if utilization falls, this block scales upward as 310 * (0.90 / CF_eff) (expanded in Product B).
Parity equation:
Net LCOA_clean = 310 + 176 * H2_cost + Temporal_Penalty - Policy_Credit

Parity when:
Net LCOA_clean <= Benchmark_Ammonia
Where Policy_Credit is the realized support term for the specific mechanism used in the case definition.
Expanded utilization-linked form for cross-note consistency: Net LCOA_clean ~= 176 H2_cost + 310 (0.90 / CF_eff) + Temporal_Penalty - Policy_Credit.
At benchmark ~$650/tonne, policy credit ~$100/tonne, temporal penalty ~$0/tonne:
H2_cost_threshold ~= $2.50/kg
At benchmark ~$650/tonne, policy credit ~$100/tonne, temporal penalty ~$50/tonne:
H2_cost_threshold ~= $2.22/kg
At benchmark ~$650/tonne, policy credit ~$0/tonne, temporal penalty ~$0/tonne:
H2_cost_threshold ~= $1.93/kg
Interpretation: Without policy support or temporal control, parity requires hydrogen costs materially below the central screening assumptions.
Named failure mode: Temporal Decoupling Failure
Temporal Decoupling Failure occurs when temporal mismatch and utilization dilution push Net LCOA_clean above the delivered benchmark despite favorable steady-state hydrogen assumptions.
Decision rule: if the threshold H2_cost <= (Benchmark_Ammonia + Policy_Credit - 310 - Temporal_Penalty) / 176 is not met, the case fails this structural parity screen.
Ammonia economics are not hydrogen economics. They are synchronization economics.
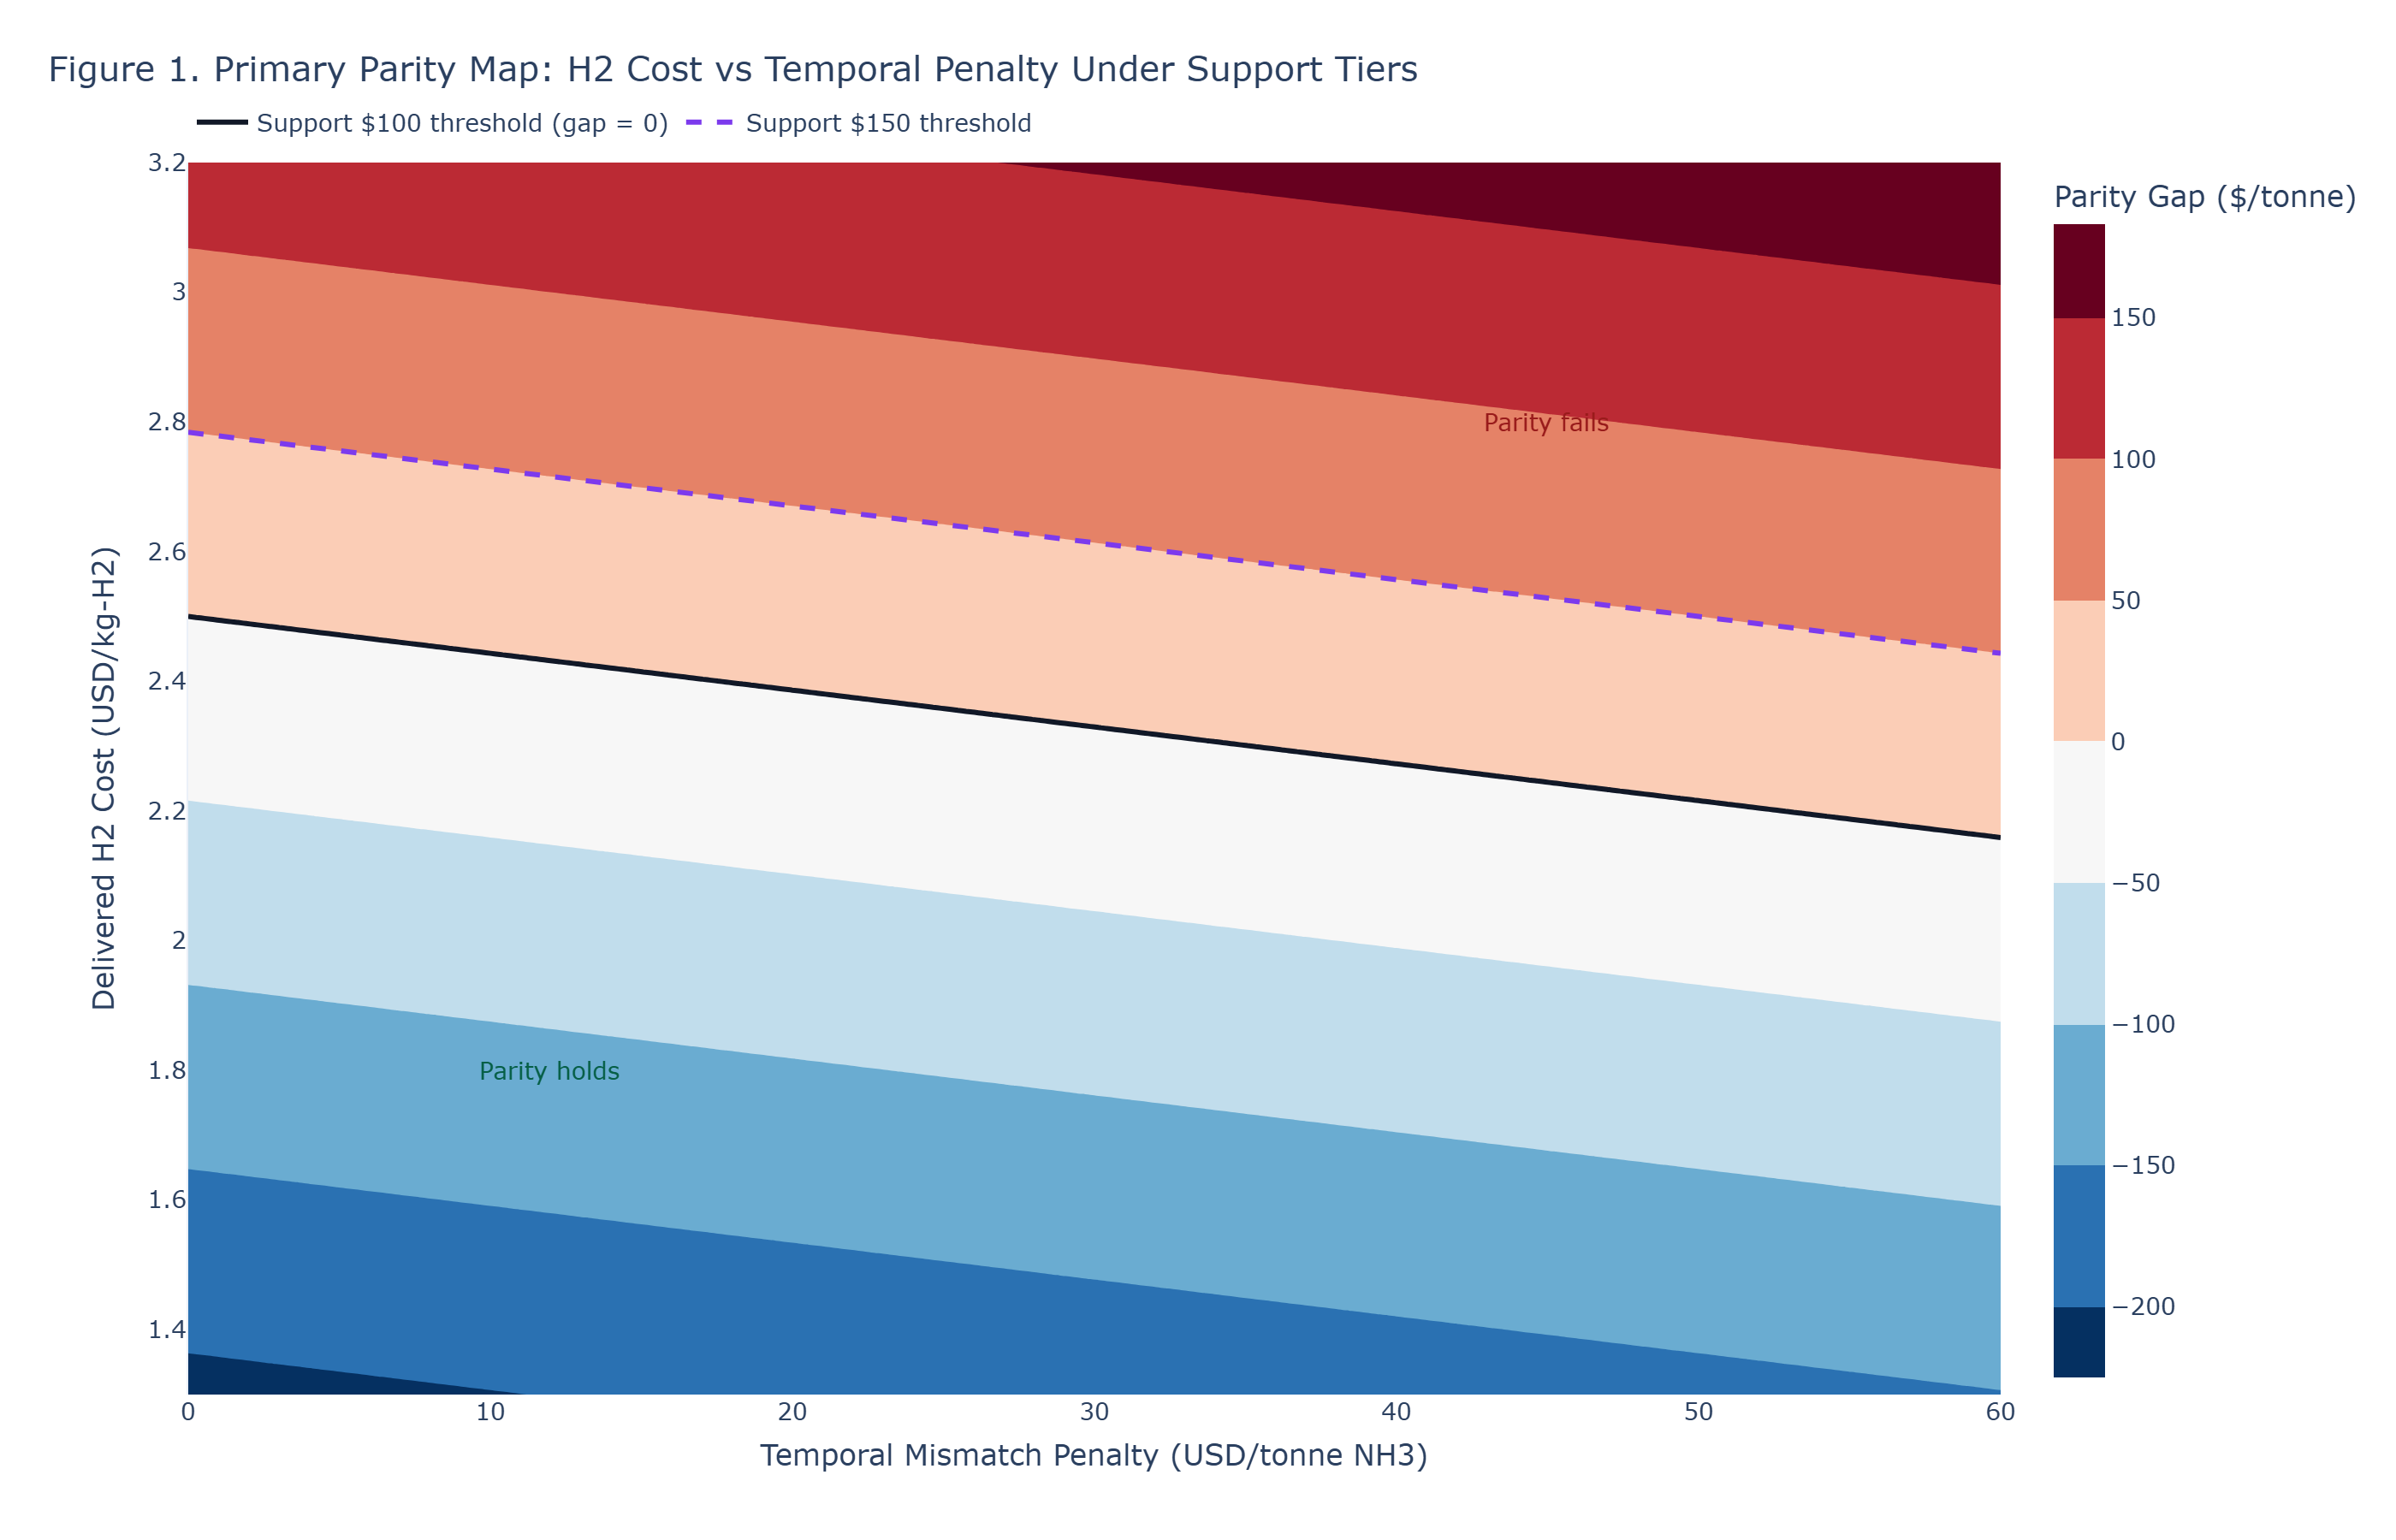
Figure 1 - Primary Parity Map
Figure 1 shows how the parity region contracts as temporal mismatch penalties increase. Focus on the boundary: higher mismatch requires lower delivered hydrogen cost to preserve parity.
Figure 1: Parity boundary map in H2-cost and temporal-penalty space under benchmark and support assumptions.
Decision statement
The parity region is concentrated in lower temporal-penalty and lower delivered-H2-cost regimes; boundary movement with support changes is first-order for screening.
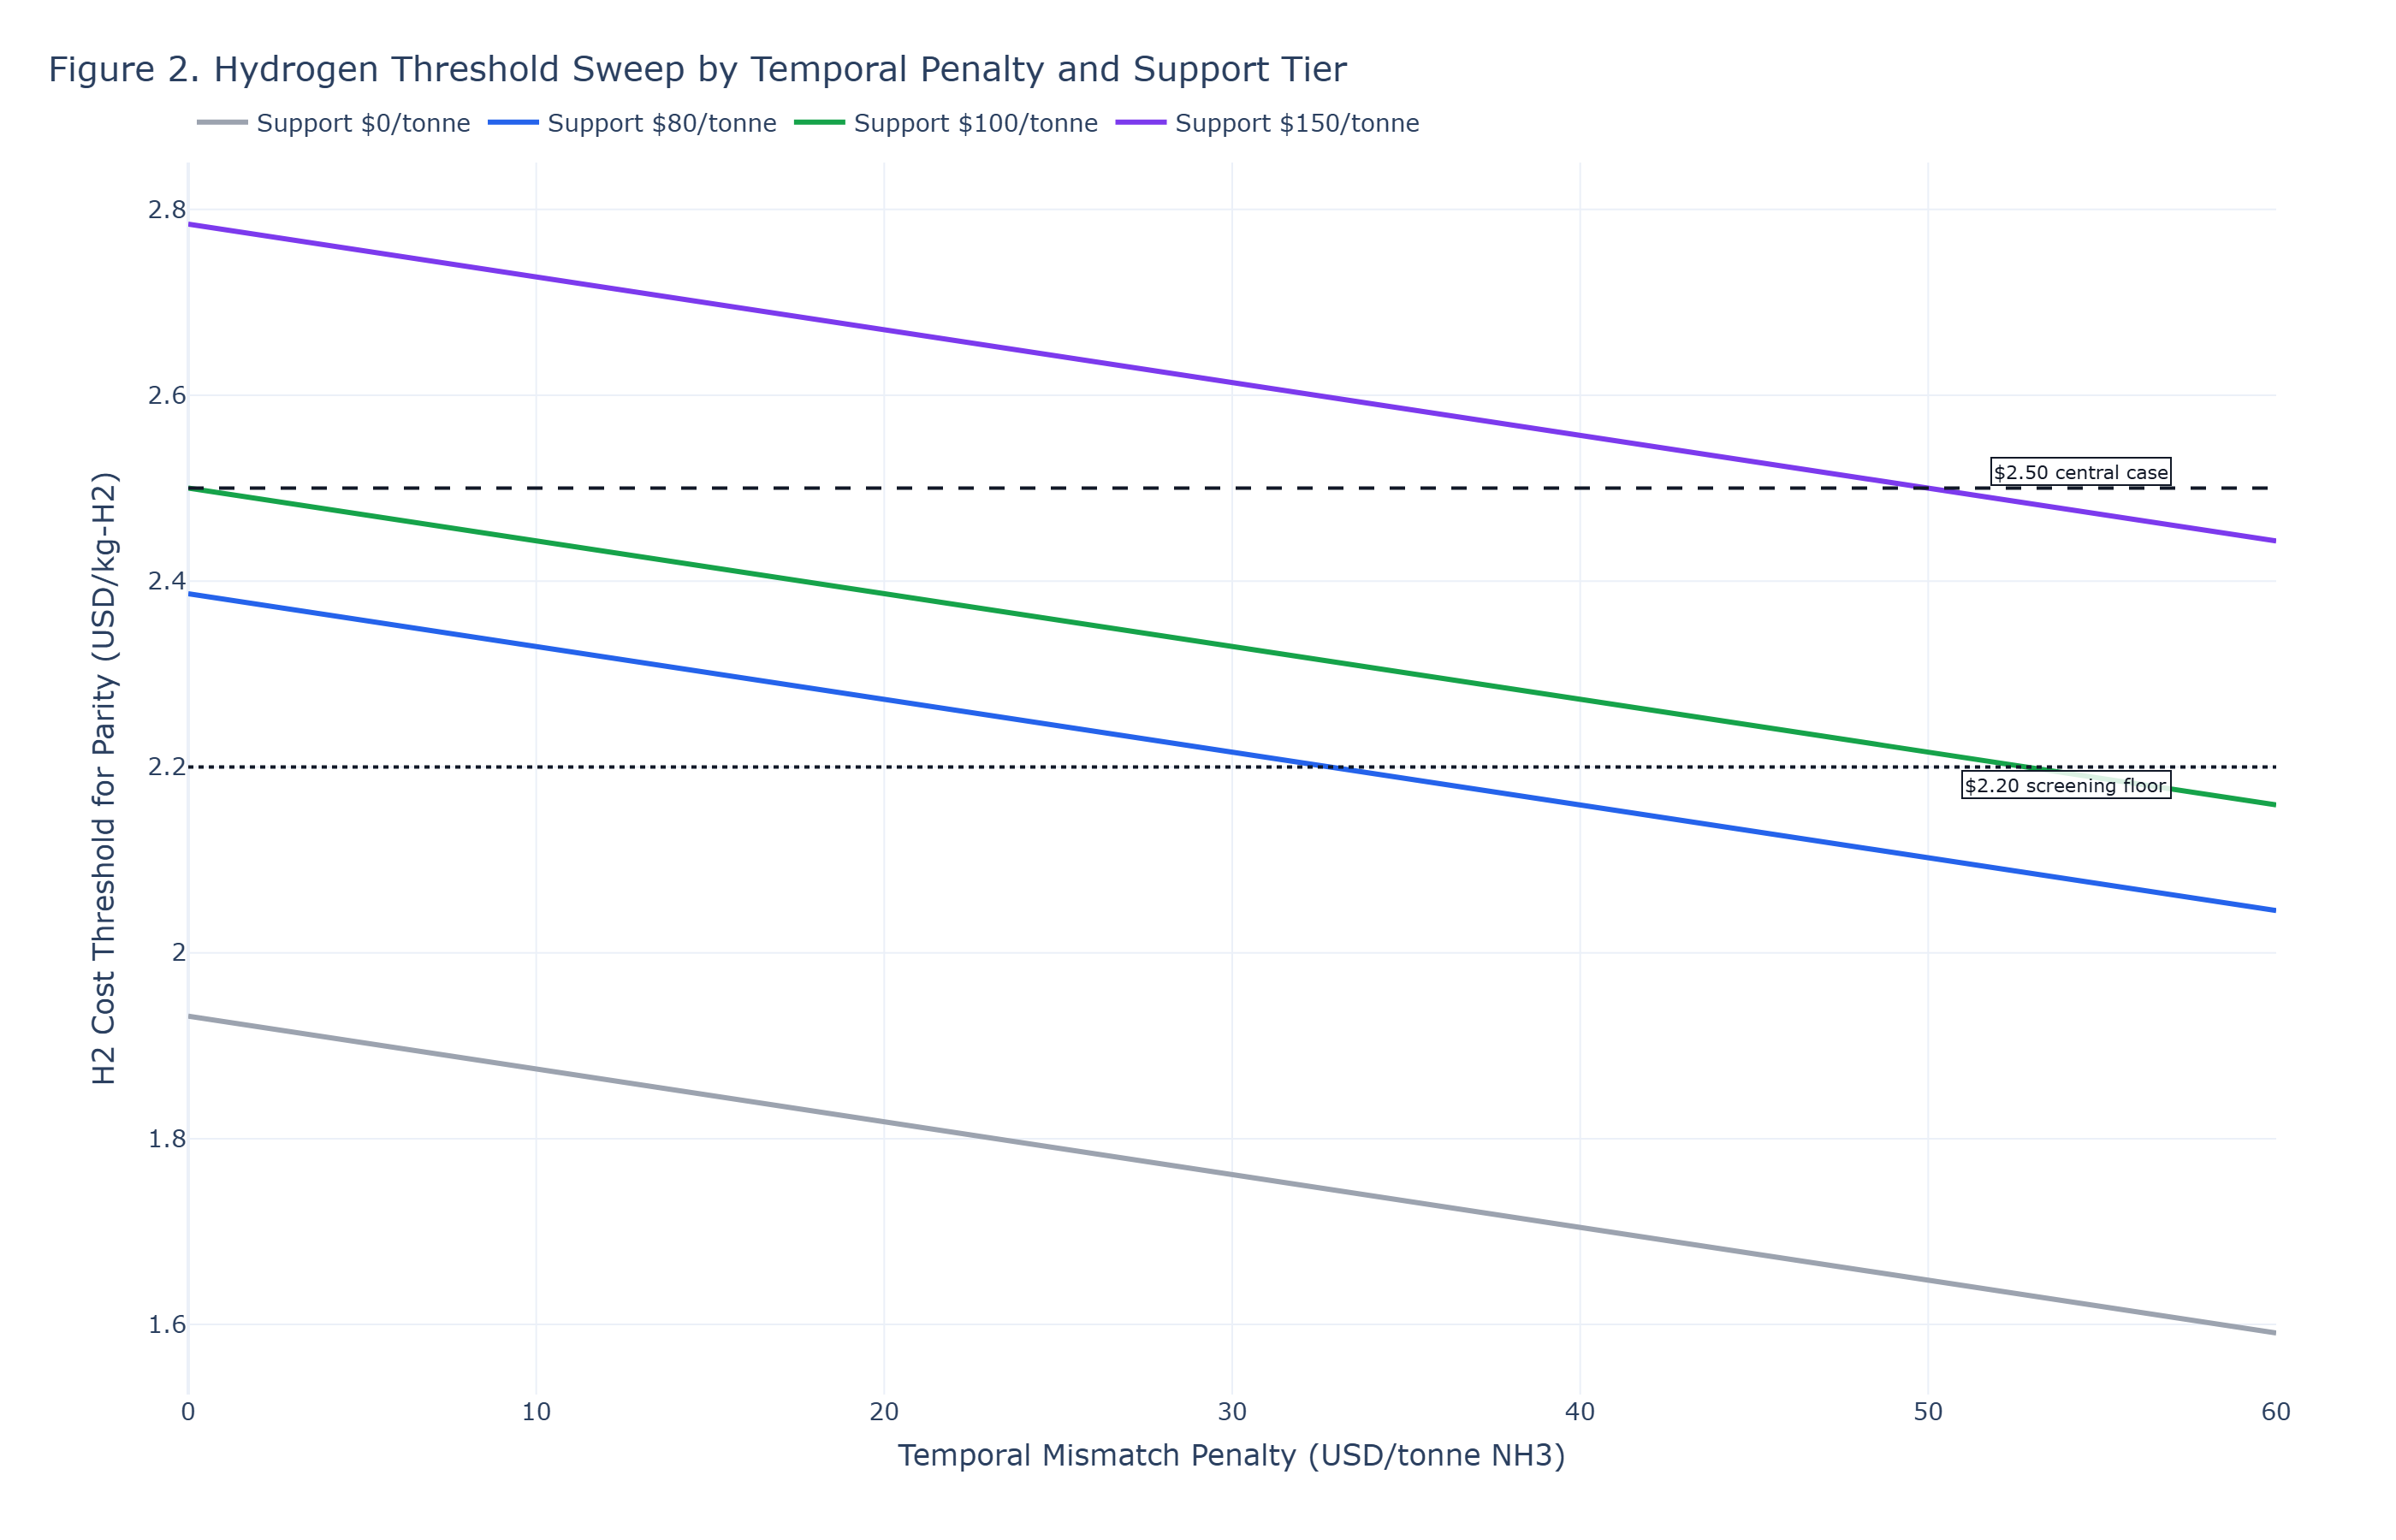
Figure 2 - Hydrogen Threshold Sweep
Figure 2 translates the same constraint into a delivered-hydrogen-cost ceiling across policy-support levels.
Figure 2: H2_cost_threshold sweep under support-tier and temporal-penalty scenarios.
Decision statement
Under low support and rising temporal penalty, the allowed hydrogen-cost ceiling tightens into ranges that are difficult to underwrite without structural redesign.
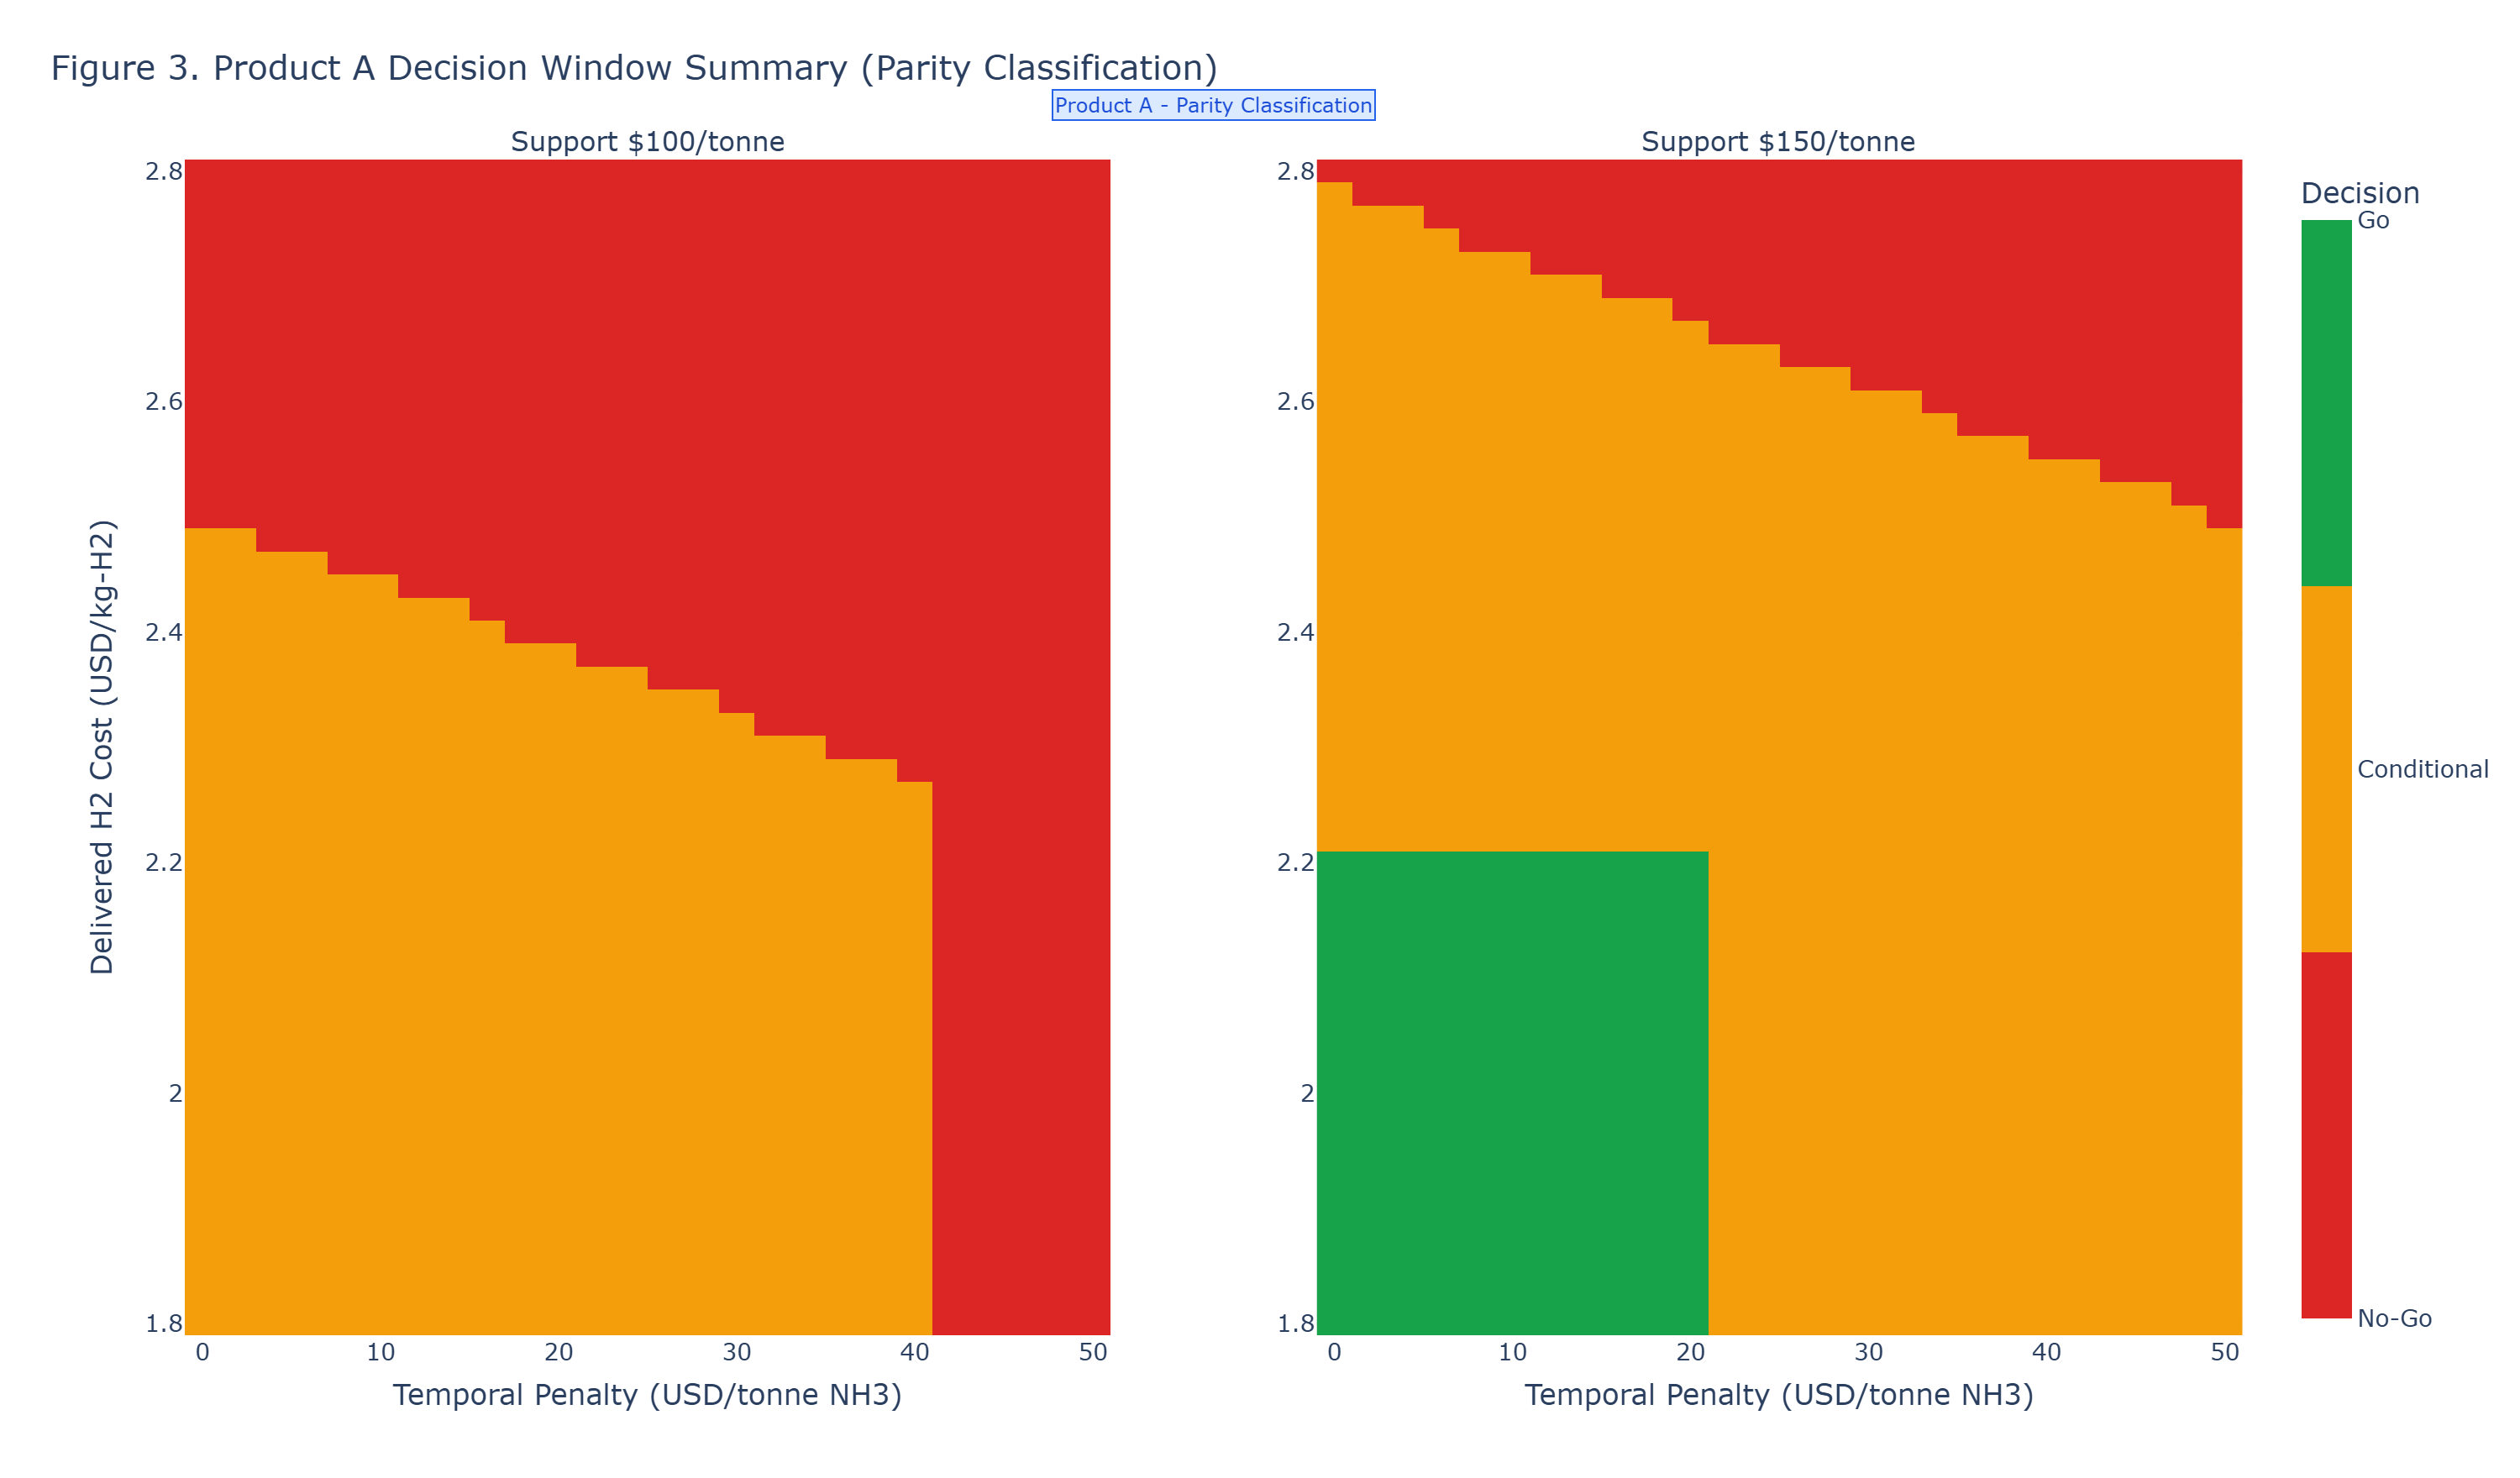
Figure 3 - Decision Window Summary
Figure 3 converts the threshold equation into decision space: Go, Conditional Go, and No-Go.
Figure 3: Go / Conditional Go / No-Go decision windows translated from the parity threshold equation.
Decision statement
Conditional-Go windows are narrow and require formula-constrained validation; interior combinations that violate the threshold must be treated as No-Go.
Reference
Scope and limitations
This is a structural parity screen, not an operational persistence conclusion.
Project-level dispatch, storage, and contract structures are parameterized at screening level; full dynamic operations simulation remains out of scope.
Temporal mismatch converts low-cost energy into high-cost product.
Fragility
Fragility Transition
The parity region identified in Product A holds only under sufficiently synchronized hydrogen availability and continuous synthesis demand. In real systems, this condition is rarely met. When mismatch penalties and utilization dilution are introduced, parts of this parity region collapse into non-viable space. Product B applies this persistence test and enforces the collapse boundary directly. Cases that enter Temporal Decoupling Failure Regime should not proceed to capital commitment. In DG-PFF handling, this regime is a direct No-Go classification unless structure is redesigned.
Inputs and thresholds: See threshold tables and linked artifacts in assets/data/notes/clean-ammonia-cost-parity-intermittent-hydrogen-continuous-synthesis/.
Reproducibility note: Parity boundaries are most sensitive to delivered H2 cost, temporal-penalty decomposition, utilization assumptions, and realized policy support.
Disclosure: Insight Quantix derived all analytical conclusions independently; external references provide context only.
Reference
How to Cite This Analytical Note
APA Format
Gomez, J. R. (2026). Clean Ammonia Cost Parity: When Intermittent Hydrogen Meets Continuous Synthesis (Insight Quantix Analytical Note IQ-AN-NH3-2026-01, v1.0). Retrieved from https://insightquantix.com/insights/clean-ammonia-cost-parity-intermittent-hydrogen-continuous-synthesis/
Chicago Format
Gomez, Jamie R. "Clean Ammonia Cost Parity: When Intermittent Hydrogen Meets Continuous Synthesis." Insight Quantix Analytical Note IQ-AN-NH3-2026-01, v1.0, April 2026. https://insightquantix.com/insights/clean-ammonia-cost-parity-intermittent-hydrogen-continuous-synthesis/.
BibTeX
@techreport{Gomez2026_NH3_Parity,
  author = {Gomez, Jamie R.},
  title = {Clean Ammonia Cost Parity: When Intermittent Hydrogen Meets Continuous Synthesis},
  institution = {Insight Quantix},
  year = {2026},
  type = {Analytical Note},
  number = {IQ-AN-NH3-2026-01},
  month = apr,
  url = {https://insightquantix.com/insights/clean-ammonia-cost-parity-intermittent-hydrogen-continuous-synthesis/}
}
Method
Appendix A: Modeling Parameters
Model form: See the governing equations and threshold definitions in the technical section of this note.
Primary data artifacts:assets/data/notes/clean-ammonia-cost-parity-intermittent-hydrogen-continuous-synthesis/
Reproducibility scope: This appendix anchors file locations and parameter traceability for decision-grade review.
Reference
About the Author
Jamie R. Gomez, Ph.D.
Principal, Insight Quantix
Chemical engineer specializing in decision-grade techno-economic analysis (TEA) and life cycle assessment (LCA) for hydrogen, sustainable aviation fuels, and power-to-liquids pathways. She translates process-level engineering models into cost, emissions, and uncertainty insights that inform capital allocation and technology scale-up decisions. Her prior work has supported technology cost-target modeling, scale-up analysis, and decision-oriented TEA/LCA efforts across federally funded clean-energy programs, including collaborations with Sandia National Laboratories, the National Renewable Energy Laboratory, ARPA-E, and clean-energy companies. She holds a PhD in chemical engineering with research focused on electrochemical materials fabrication.
Insight Quantix publishes independent analytical work for transparency and decision clarity. The analysis examines benchmark-anchored, audit-defensible economic risk conditions relevant to capital allocation decisions in the $10M-$500M range.
Validation Methodology: ASTM E3200 | ISO 14040/14044 | NREL benchmark-anchored Engine Documentation: Available upon request Website:insightquantix.com
Legal Disclaimer This analytical note is provided for informational and educational purposes only and does not constitute investment advice, financial advice, engineering design recommendations, or legal interpretation of tax policy. Readers should conduct independent due diligence and consult qualified professionals before making capital allocation decisions. The analysis reflects representative scenarios based on stated modeling parameters and should not be construed as a guarantee of project performance or economic outcomes. Specific project economics require site-specific analysis accounting for local conditions, technology configurations, and regulatory environments. Insight Quantix makes no warranties, express or implied, regarding the accuracy, completeness, or reliability of this information for any particular purpose.