45V Hydrogen Cost Parity: When Clean H2 Beats Grey
Most modeled 45V hydrogen projects are not viable: the exact electricity-price and utilization floors where parity fails
IQ-AN-H2-45V-2026-01 · 2026-06-19 · v2.0 · 15 min read
Plain-English takeaway
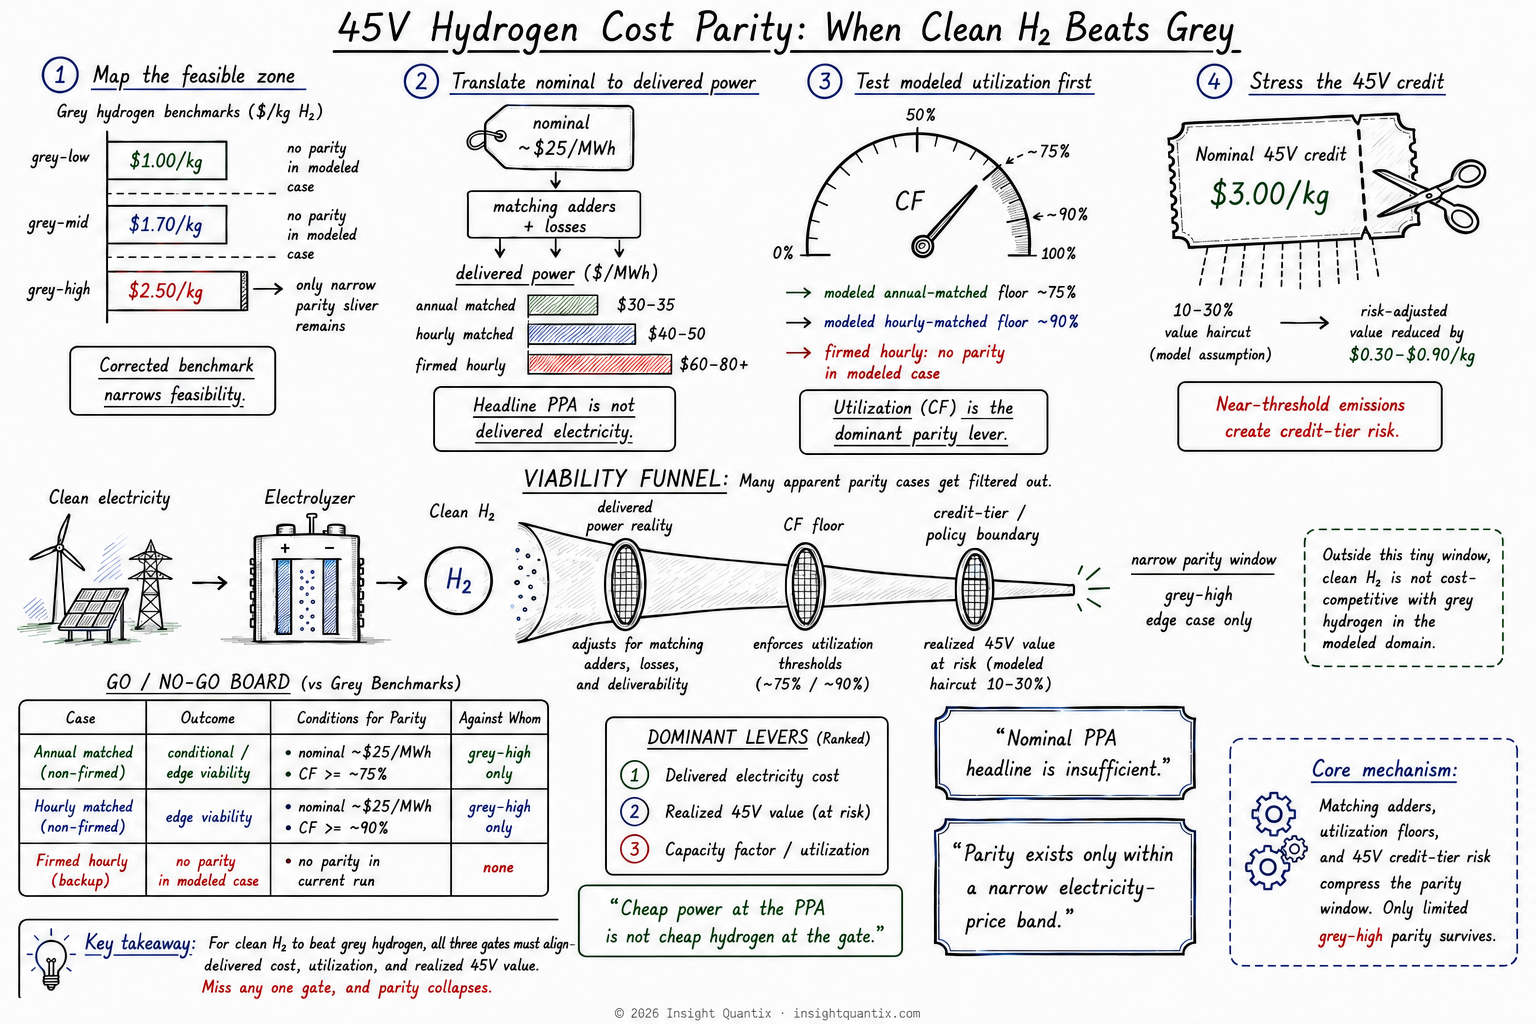
Cheap electricity at the PPA is not the same as cheap hydrogen at the project gate. In the corrected model, clean hydrogen does not reach parity with the $1.00/kg or $1.70/kg grey benchmarks anywhere in the modeled domain. Only a narrow edge case remains against the $2.50/kg grey-high benchmark.
Why this matters
Three gates must align before a parity claim becomes decision-relevant: nominal electricity must translate into acceptable delivered power cost, the electrolyzer must maintain the required utilization floor, and the project must realize enough of the expected 45V credit.Miss any one gate, and the parity window collapses.
GO: No broad, robust parity region is observed in the current scenario grid.
CONDITIONAL / EDGE: Annual-matched, non-firmed procurement near $25/MWh with CF >= 75%, or hourly-matched, non-firmed procurement near $25/MWh with CF >= 90%, can reach parity against the grey-high benchmark only.
NO-GO: Claims against grey-low or grey-mid benchmarks, firmed-hourly configurations in the current run, or cases that do not explicitly translate nominal power into delivered cost.
What drives the result
Delivered electricity cost: Matching, congestion, shaping, transmission, and losses determine the cost entering the electrolyzer.
Capacity factor: Utilization is the dominant parity lever; low runtime spreads fixed capital across fewer kilograms.
Realized 45V credit: A 10% to 30% haircut on a nominal $3.00/kg Tier 1 credit removes roughly $0.30 to $0.90/kg of effective value.
Grey benchmark: The remaining parity window exists only at the grey-high edge of the modeled benchmark range.
Decision
Kill Conditions
Treat the following configurations as immediate No-Go unless the operating, procurement, or policy structure changes:
No delivered-power translation. A nominal PPA price without explicit matching adders, congestion, shaping, transmission, and loss assumptions is not underwritable.
Utilization below the strategy threshold. Annual-matched cases below roughly 75% CF and hourly-matched cases below roughly 90% CF do not preserve the observed edge-case parity.
Firmed-hourly procurement in the current modeled range. No parity is observed across modeled capacity factors of 30% to 95% and nominal prices of $25 to $110/MWh.
Parity depends on full nominal credit realization near a tier boundary. Re-test with haircut scenarios before treating the credit as durable.
The claim requires grey-low or grey-mid parity. Neither benchmark clears in the corrected scenario grid.
Context
Technical Note (Audit Trail)
The sections below preserve the model definition, threshold logic, parameter traceability, figures, scope, limitations, and reproducibility record supporting the decision screen.
Context
1. Decision Context
Treasury's finalized 45V guidance transforms clean hydrogen economics from a nominal LCOH comparison into a compliance-constrained cost problem. For developers and industrial users, the relevant question is no longer whether green hydrogen can be cheap in theory, but under what electricity price, matching strategy, and utilization conditions it can undercut grey hydrogen at the user gate while remaining inside a credit tier.
This creates a concrete siting and contracting decision: Do we prioritize cheap electrons with harder delivery and utilization risk, or easier delivery with higher power costs - and which procurement structures keep realized hydrogen cost below grey without falling out of the credit tier.
This note is intentionally a structural parity screen. It does not evaluate operational breakdown dynamics (intermittency-driven utilization collapse, dispatch volatility, or fixed-cost amplification under unstable runtime).
The feasibility regions identified in this analysis assume sustained utilization. How matching constraints, intermittency, and procurement structure erode that utilization - and where they break parity entirely - is examined in the companion utilization risk note.
Method
2. Parity Claim
The parity claim tested in this analysis is that clean hydrogen production can undercut delivered grey hydrogen cost under the 45V incentive structure.
Method
3. Parity Metric
Parity is defined at the threshold where delivered clean hydrogen cost equals delivered grey hydrogen cost for each benchmark band, conditional on procurement strategy and sustained utilization.
Fragility
4. Fragility Metric
Driver 1 - Effective Power Cost Under Matching Constraints
Engine results show that effective power cost -not headline PPA price -dominates clean H2 parity outcomes. Once hourly (or near-hourly) matching, congestion exposure, shaping, and curtailment effects are included, delivered electricity cost can diverge substantially from nominal prices.
Quantitative Signal
Across representative scenarios, parity is achieved only when effective electricity cost falls below a narrow band; nominal low prices alone are insufficient if matching erodes utilization or introduces shaping penalties.
Utilization emerges as a first-order driver of LCOH, often outweighing nameplate CAPEX differences across electrolyzer configurations.
Quantitative Signal
Model sweeps indicate that modest reductions in capacity factor can overwhelm gains from lower electricity prices, pushing clean hydrogen back above grey even when credit eligibility is preserved. This makes siting and procurement inseparable from utilization strategy.
Driver 3 - Credit Tier Proximity Risk
45V credits behave discontinuously. Being near a tier boundary introduces realized value risk that meaningfully affects parity.
Quantitative Signal
Engine scenarios show that projects operating close to eligibility thresholds experience effective credit values significantly below the nominal tier, shifting parity conditions by meaningful margins. This creates a hidden tradeoff between aggressive cost minimization and credit robustness.
Decision translation: A project running 10% to 30% haircut risk on the nominal $3.00/kg Tier 1 credit has already lost roughly $0.30 to $0.90 per kg in effective value before financing penalties are applied.
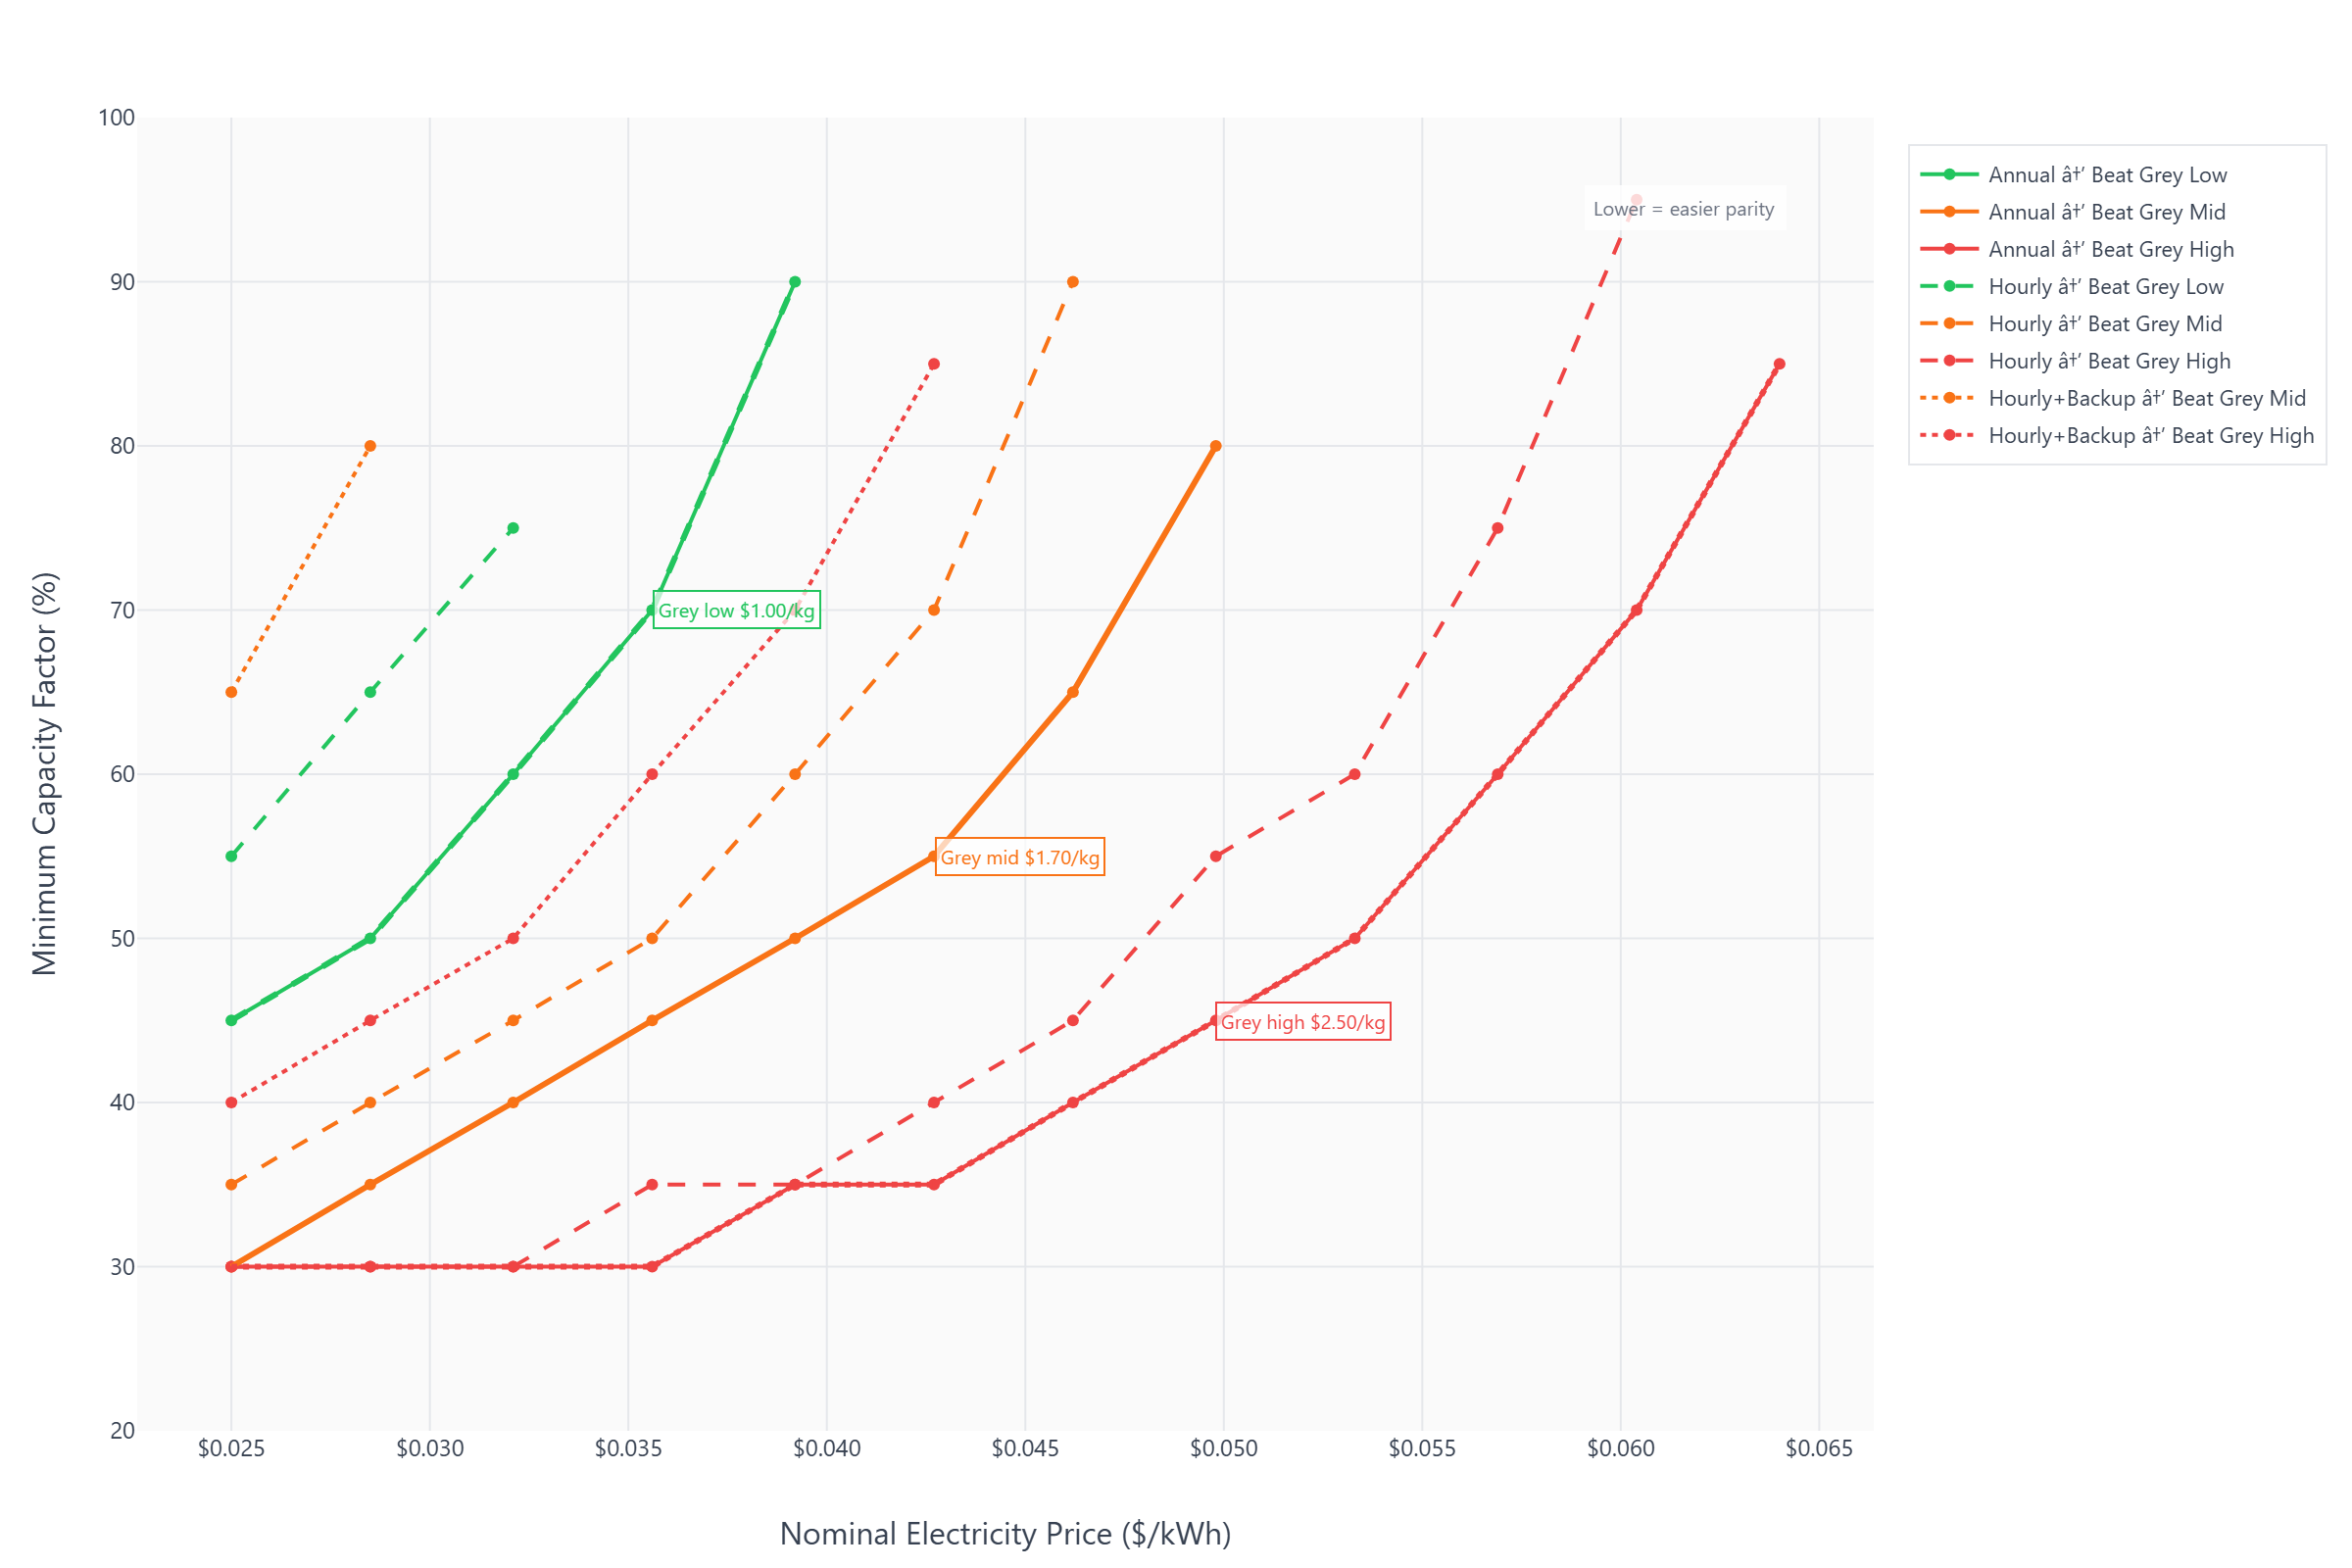
Figure 1 shows the minimum capacity factor required for clean hydrogen to beat each grey benchmark at a given electricity price. Focus on where the threshold curves leave the achievable operating range.
Minimum CF required to beat grey H2 at each electricity price
Figure 1: Minimum capacity factor required to achieve cost parity with grey hydrogen across electricity prices and matching strategies. Lower curves indicate easier parity conditions.
Key Takeaway
Across all matching strategies, the minimum capacity factor required for clean hydrogen to undercut grey increases sharply with electricity price, indicating that utilization -not nameplate cost -is the dominant parity lever. Hourly matching strategies consistently require higher utilization to reach parity.
Decision relevance: Use this map to identify the minimum CF required at each price band for the chosen matching strategy.
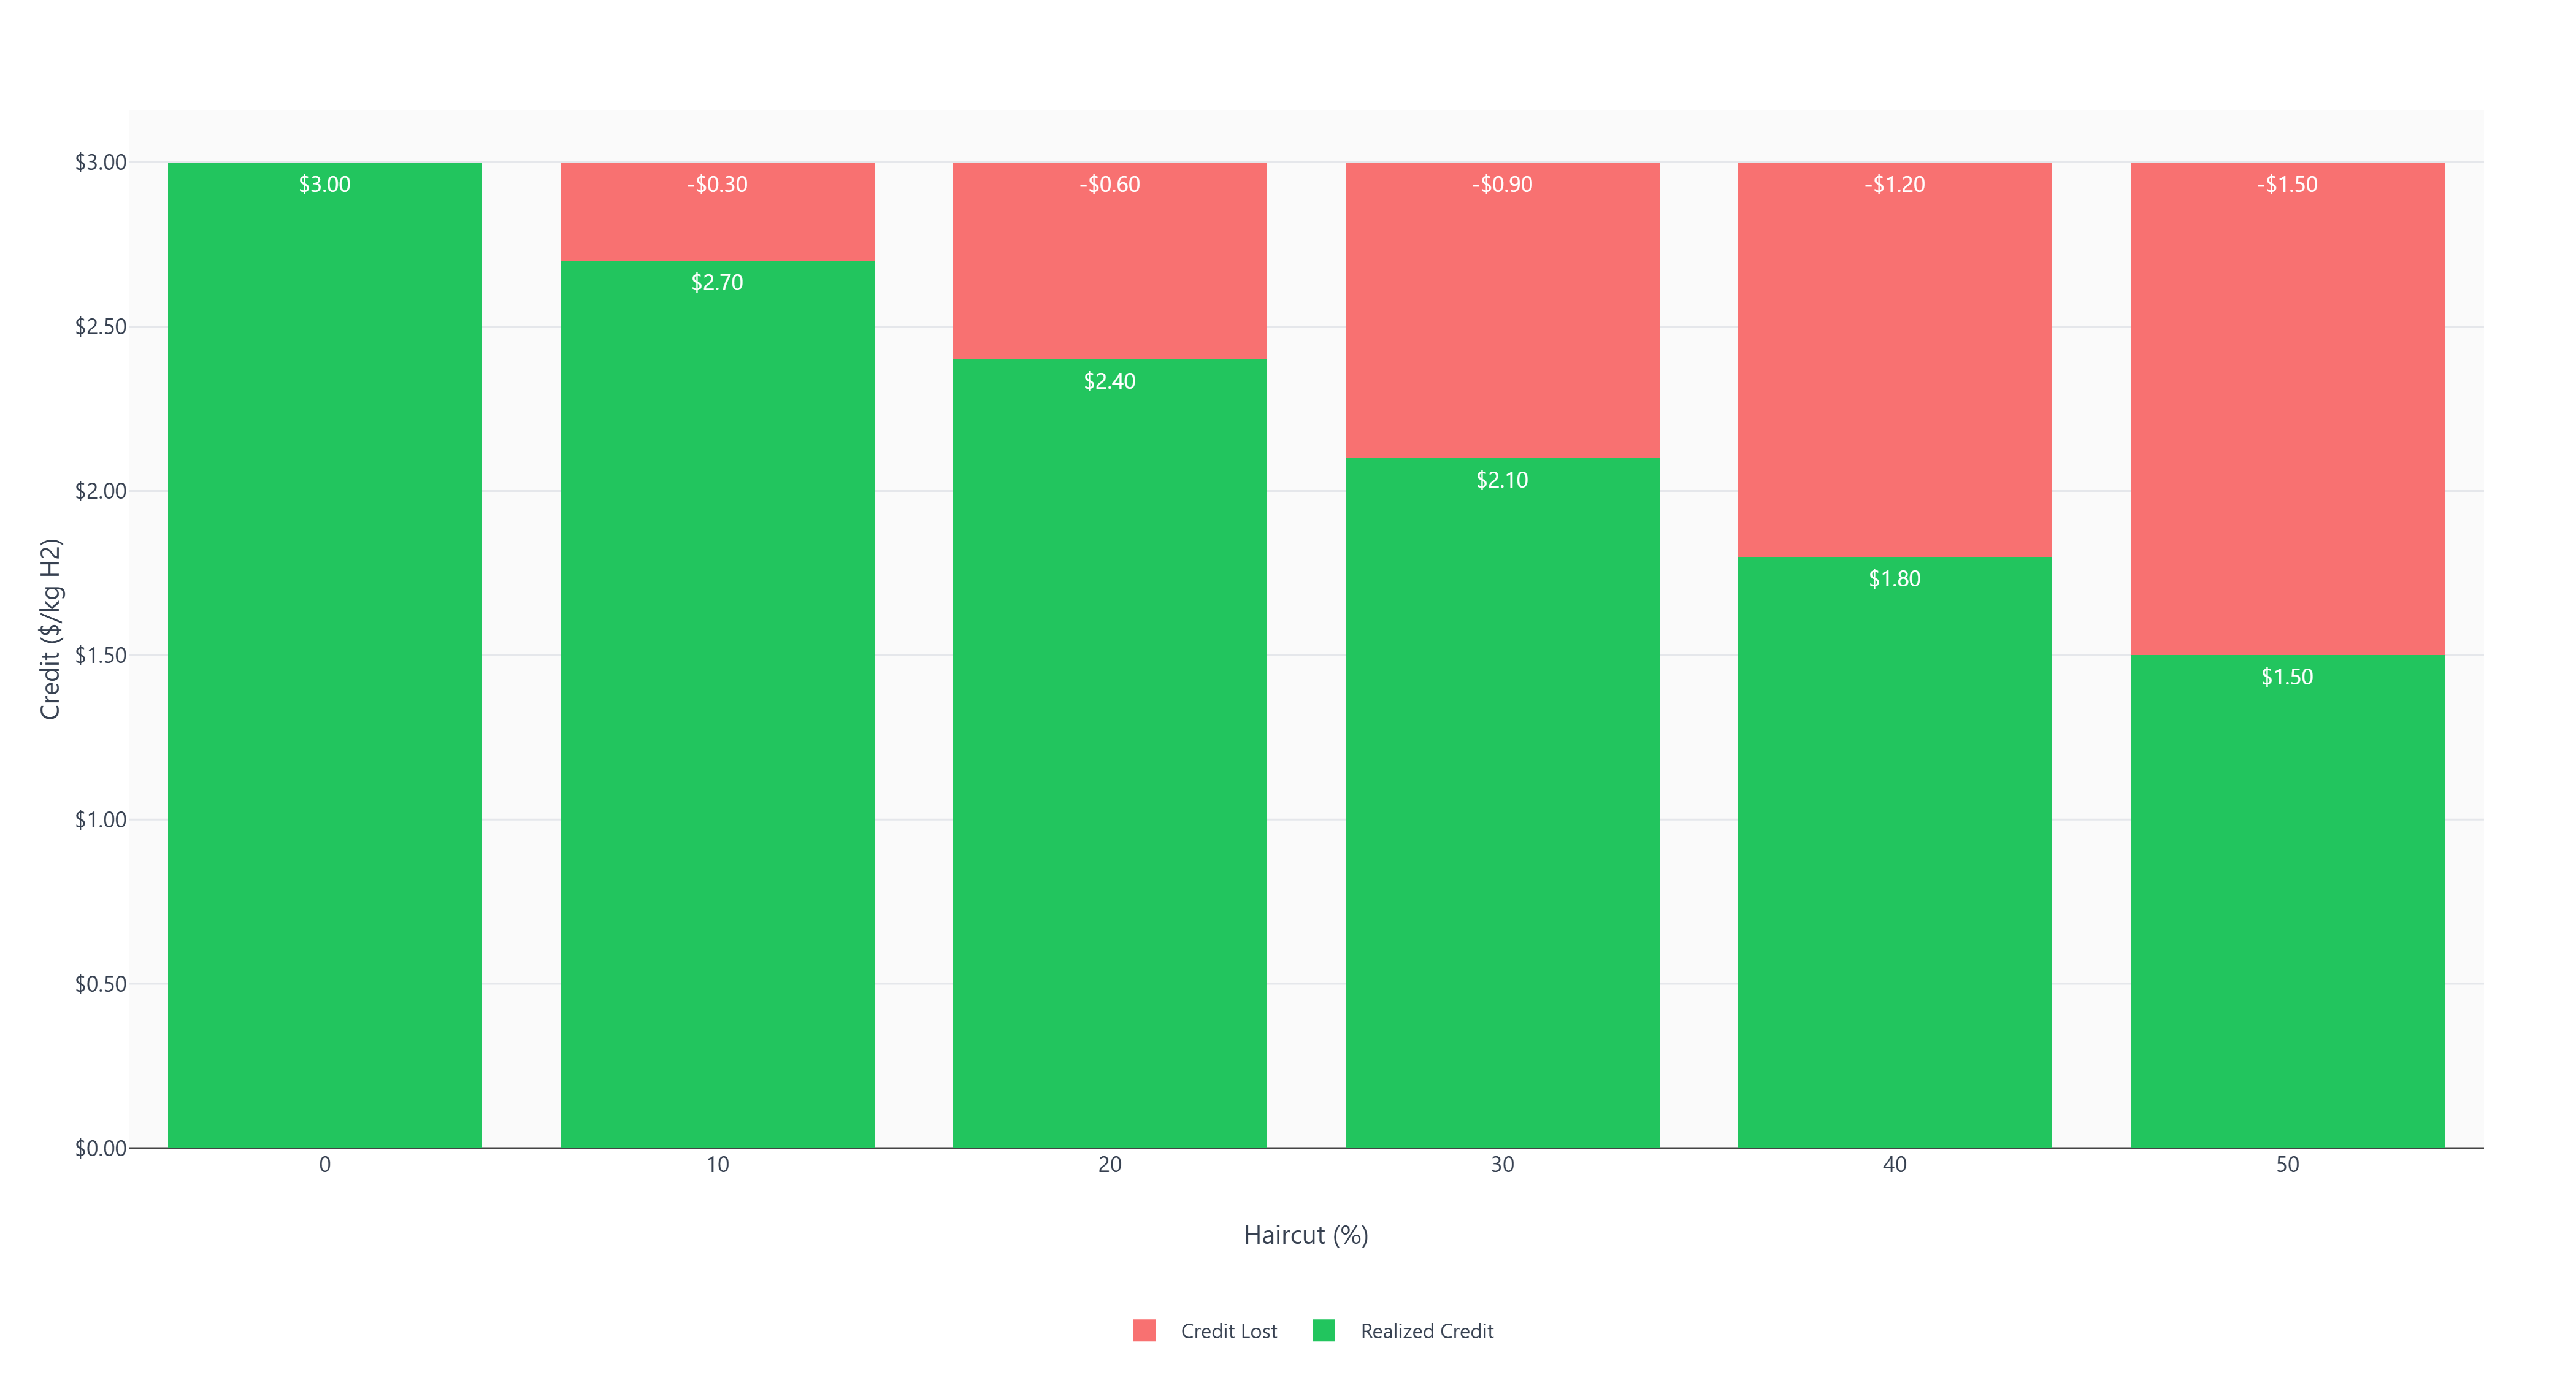
Figure 2 - Credit Haircut Sensitivity
Figure 2 shows how tier-boundary risk reduces the effective 45V credit. The decision-relevant quantity is realized credit after the haircut, not the nominal tier value.
Tier 1 base credit: $3.00/kg
Figure 2: Effective credit value under illustrative tier proximity scenarios. Green shows realized credit; red shows credit lost to boundary risk.
Key Takeaway
Projects operating near tier boundaries can experience effective credit values significantly below the nominal $3/kg, shifting parity conditions by meaningful margins even without changes in physical system performance.
CFO translation: If credit realization is haircut by 10% to 30%, effective value falls by $0.30 to $0.90/kg. Many "near-parity" cases fail immediately under that adjustment.
Note: Illustrative haircut applied to represent verification and boundary risk under Treasury's finalized emissions accounting framework.
Decision relevance: Treat tier proximity as a risk haircut; do not underwrite parity on nominal credit alone.
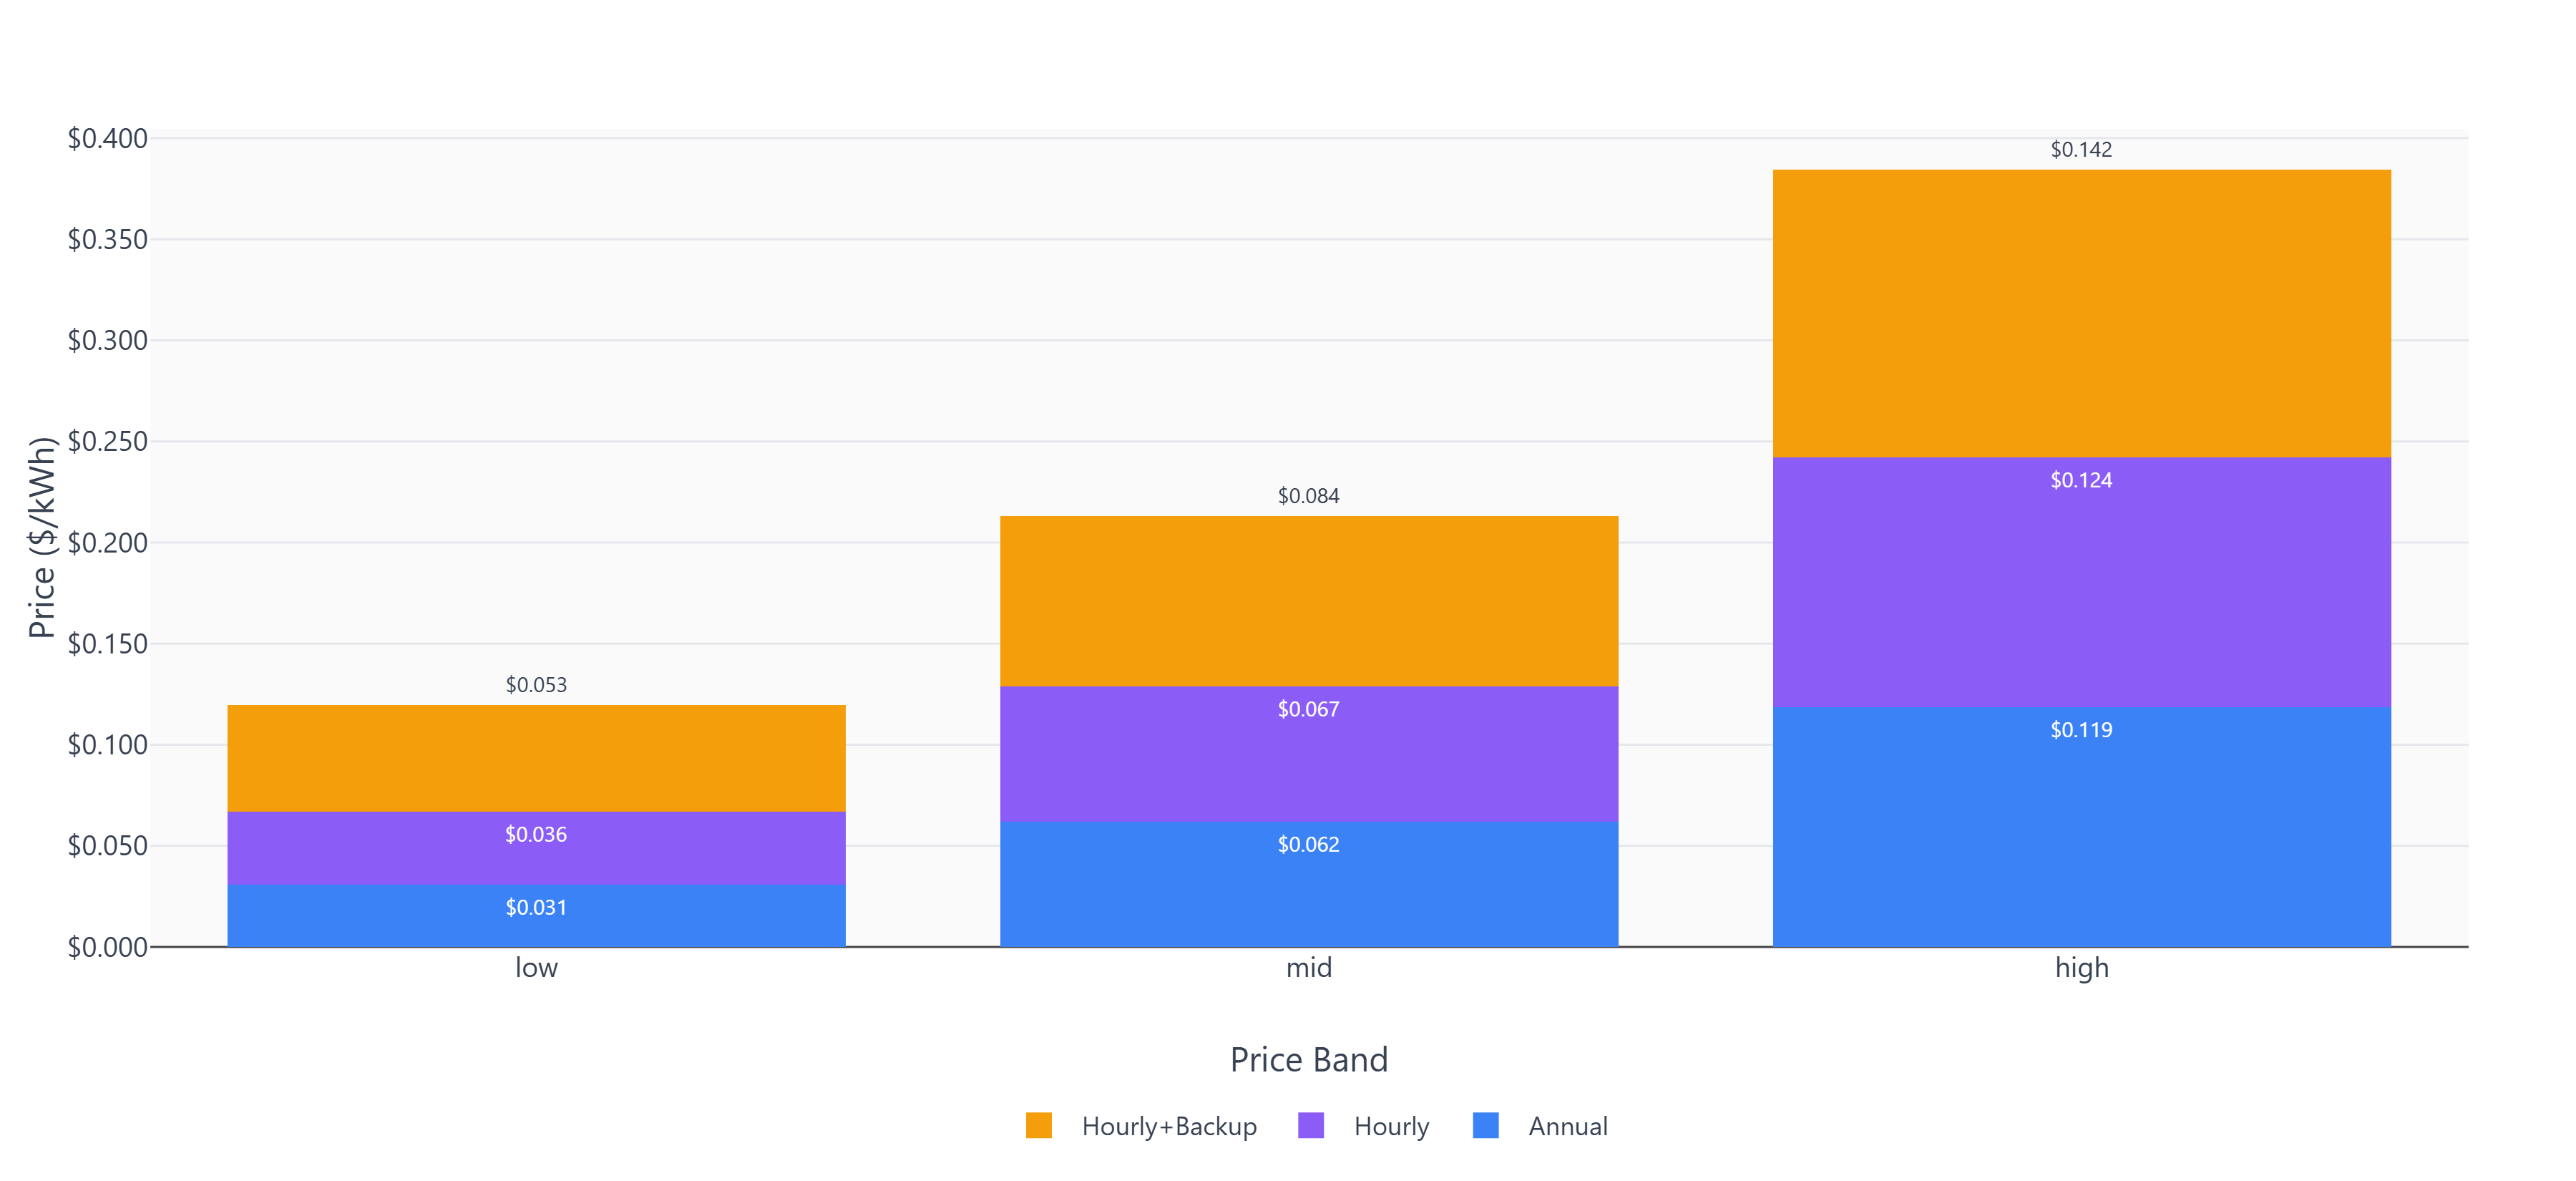
Figure 3 - Effective Electricity Price by Strategy
Figure 3 translates nominal electricity into delivered cost across procurement strategies. The widening bars show how matching and firming consume parity headroom.
Includes adders and loss adjustments
Figure 3: Delivered electricity cost after matching requirements, firming costs, and transmission losses. Bars show three nominal price bands (low/mid/high) across three procurement strategies.
Key Takeaway
Across all price bands, effective electricity cost diverges substantially from nominal prices once matching and firming are included. This invalidates the assumption that "we locked in $0.03/kWh power" translates to "$0.03/kWh delivered to electrolyzer."
Note: Effective price reflects nominal price plus modeled adders (procurement/shaping) and loss penalties (transmission/conversion). See Appendix A for parameter values.
Decision relevance: Compare delivered cost, not PPA headline; adders and losses often dominate feasibility.
Figure 4 - LCOH vs Capacity Factor
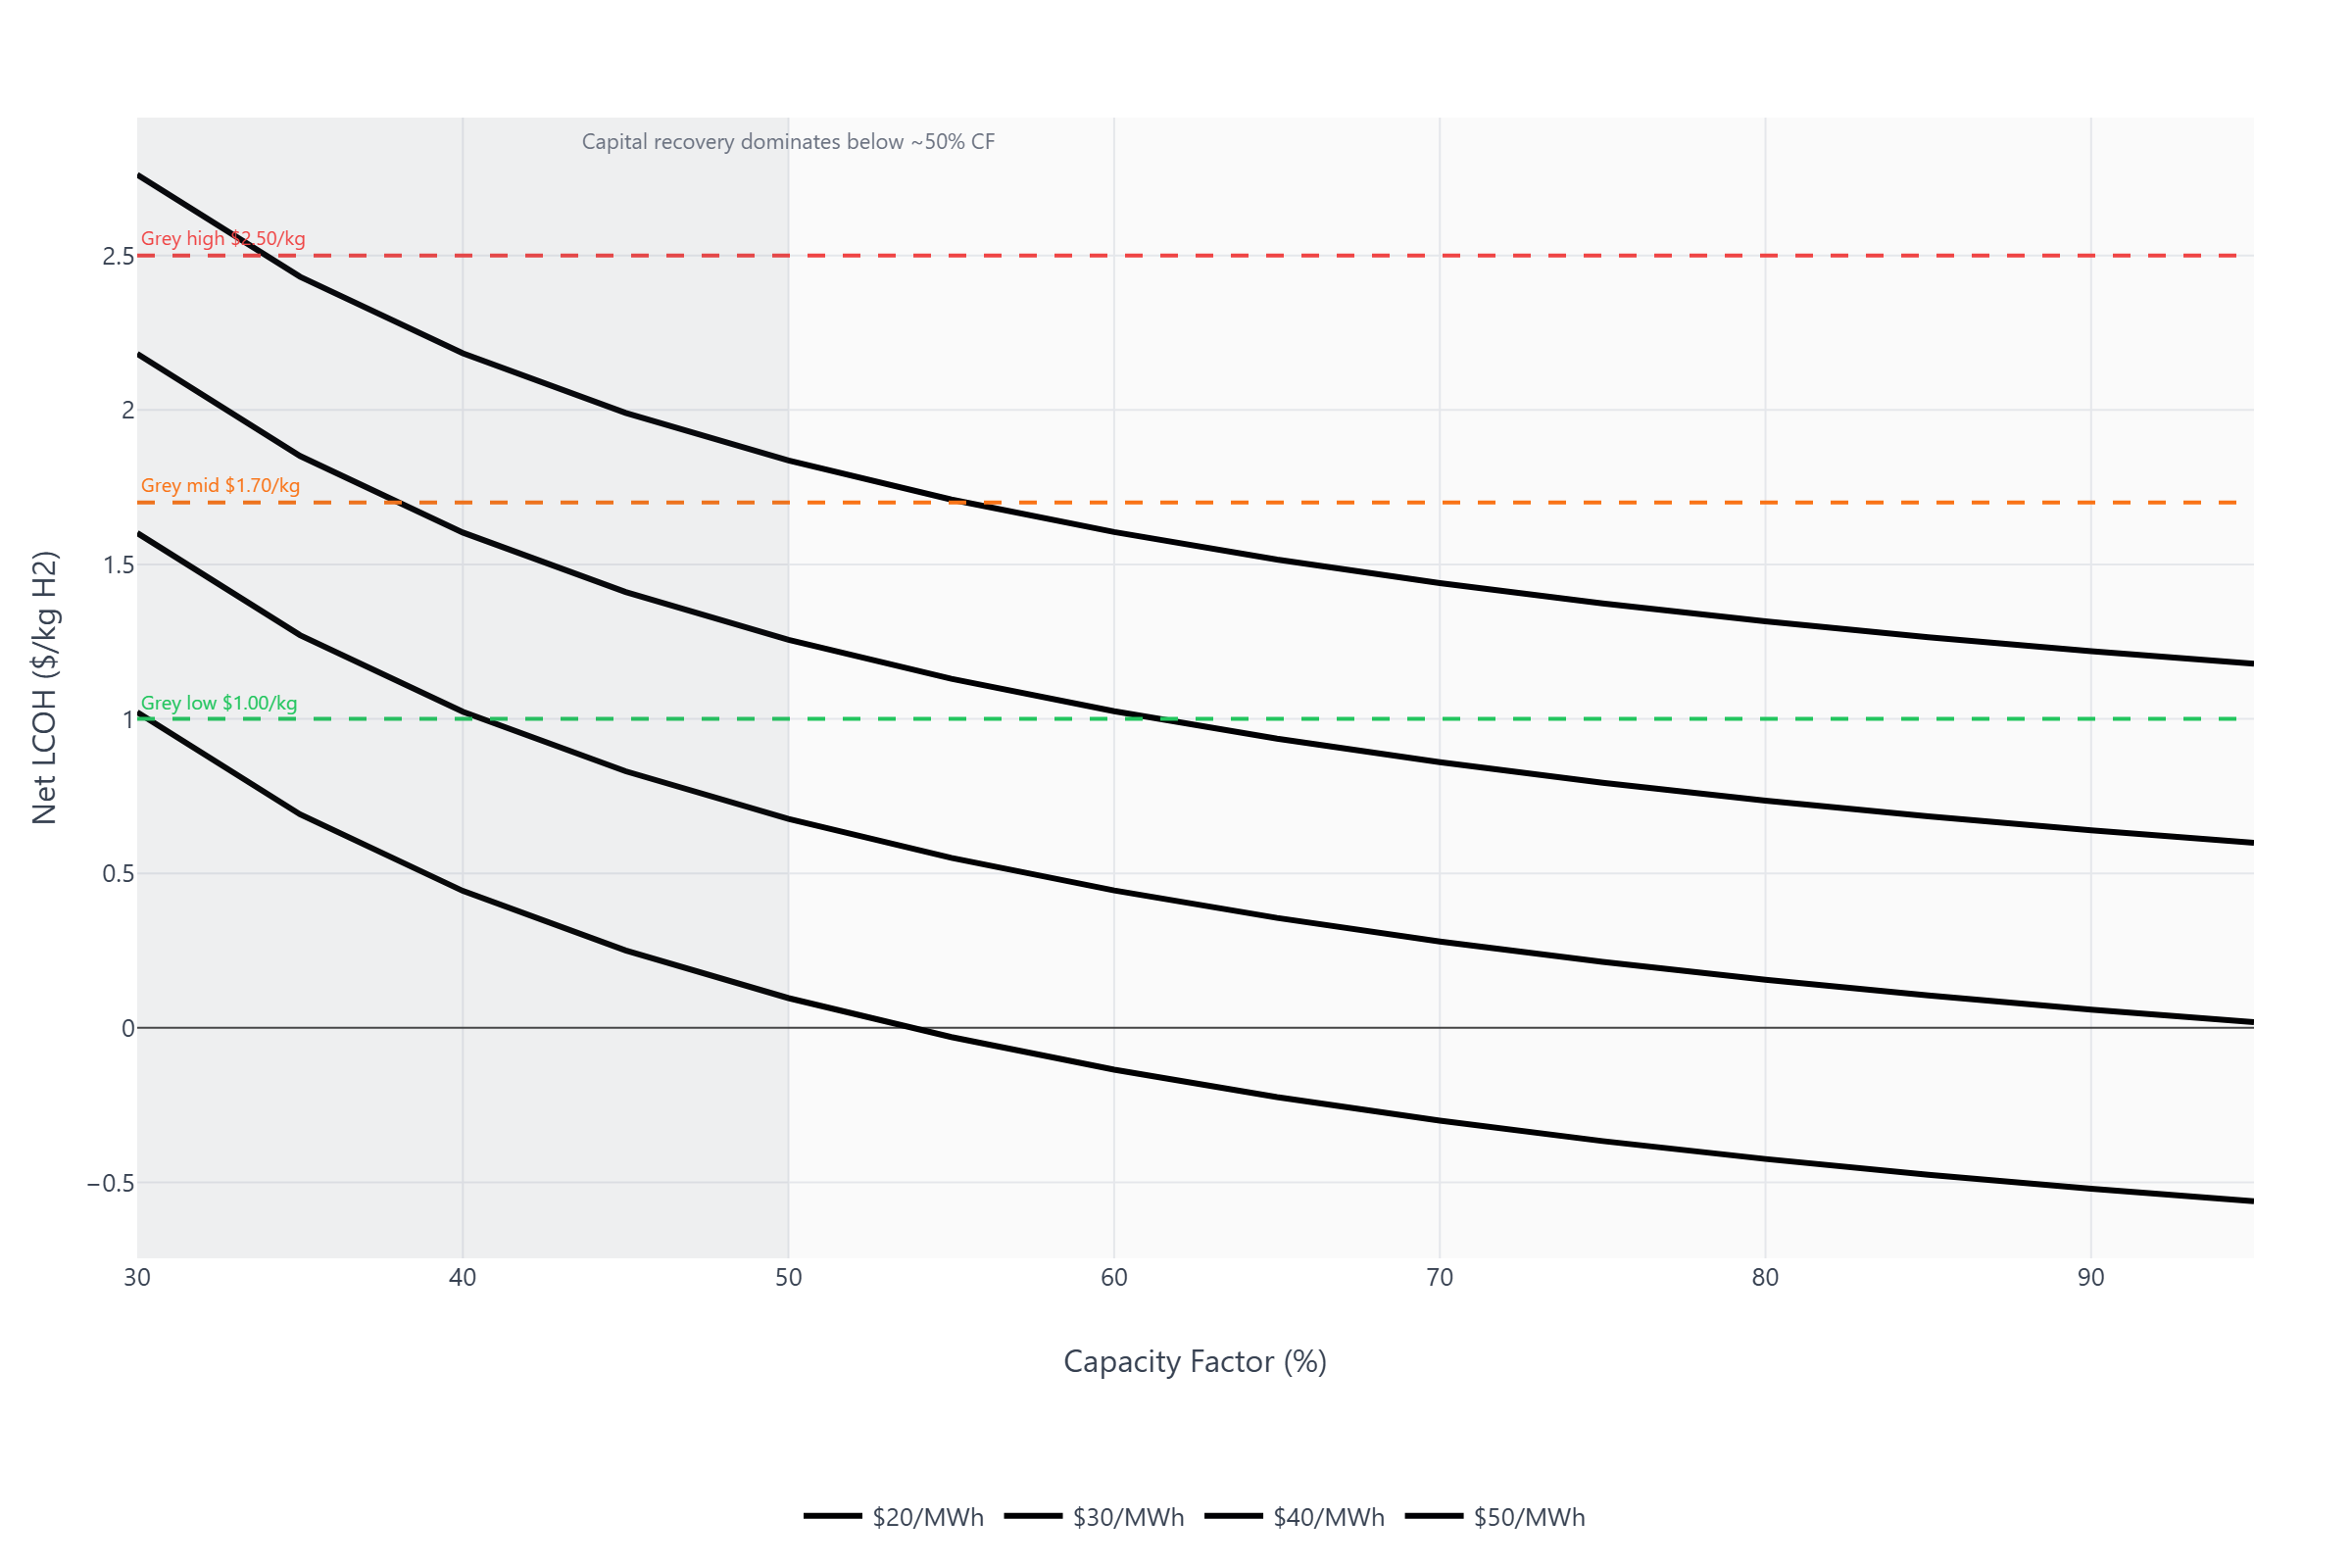
Figure 4 shows how lower utilization raises levelized hydrogen cost. Compare the operating range with the grey-hydrogen benchmark lines before relying on a low-power-price case.
Figure 4: Levelized cost of hydrogen as a function of electrolyzer capacity factor. Solid lines show net LCOH (post-credit); dashed lines show gross LCOH (pre-credit). Horizontal dashed lines indicate grey hydrogen cost benchmarks.
Key Takeaway
Across all matching strategies, LCOH declines nonlinearly with capacity factor, with modest reductions in utilization producing outsized cost increases. A project at 50% CF pays a steep LCOH penalty that cannot be recovered by marginal electricity cost reductions.
Decision relevance: Use this to judge how far utilization can fall before parity breaks under each strategy.
Decision
6. Decision Implications
Siting: Locations with ultra-low nominal electricity prices do not automatically win if delivery, congestion, or matching reduce utilization.
Procurement: Contracting structures that stabilize utilization and emissions alignment can be economically superior to lowest-price energy strategies.
Design: Electrolyzer sizing and operating philosophy should be co-optimized with matching strategy -not treated as fixed inputs.
Risk posture: Projects optimized to just clear a 45V tier may underperform those designed with margin, even at slightly higher baseline costs.
Reference
Scope & Boundaries
Boundary statements (scope gate):
Geography/market: United States; 45V-eligible clean hydrogen markets.
System boundary: Delivered-to-gate cost parity (user gate), not plant fence or policy-adjusted averages.
Time boundary: Commercial year 2026 with 45V policy vintage valid as of February 1, 2026. Interpretation is windowed: transition (2025-2029, annual matching assumptions) and long-run (2030 onward, hourly matching assumptions).
Analytical scope (excluded disciplines): No legal interpretation, certification advice, detailed process engineering/design, permitting, or grid-dispatch modeling.
Baseline definition: Grey hydrogen comparators defined by low/mid/high delivered cost benchmarks in Appendix A (reference cases only).
Interpretation guardrails: Forward-looking inputs are scenario assumptions, not predictions. This brief is an economic parity analysis; it is not legal advice, not a project certification, and not a forward price forecast.
Reference
Limitations & Critiques
Scope does not perform full dispatch-level policy simulation. The note incorporates policy-window interpretation and matching-regime comparison, but it does not explicitly model full hourly dispatch, EAC procurement microstructure, or all implementation constraints (additionality, deliverability, and timeline interactions) at plant level. These factors can materially influence cost outcomes and procurement feasibility. See: Treasury final rules, IRS IRB 2025-13.
Limited context on market/attribute risk. While the note models matching strategies, it does not dig into real electricity market risks - grid congestion, capacity deliverability shortfalls, REC/EAC availability, or regional price volatility - that can drive delivered power costs far from model assumptions. See: RMI analysis.
Benchmarking vs project-specific realities. Using stylized grey hydrogen cost bands and fixed electricity price ranges is a reference-case baseline and does not capture regional or temporal natural gas volatility, grid decarbonization dynamics, or supply configuration shifts. Forward-looking inputs are scenario assumptions, not predictions. Multiple benchmarks and sensitivities mitigate (but do not eliminate) this risk.
No lifecycle emissions context. The analysis is strictly economic and does not integrate lifecycle GHG impacts beyond what is implied by 45V credit tiers. Broader environmental or carbon-pricing considerations are outside scope.
Response / Mitigations. This analysis is intentionally a parity lens. In practice, we recommend stress-testing parity against alternative matching regimes (annual vs hourly), regional deliverability constraints, and EAC price scenarios, and reporting those sensitivities alongside base-case parity maps. We also recommend pairing parity results with LCA summaries and policy-compliance checklists for project-specific diligence.
Method
Methods & Traceability (Analytical Lens)
This note applies a techno-economic parity lens using representative model runs from the Insight Quantix analysis engine. Key features of the lens:
Comparison at the user gate (not plant fence, not policy-adjusted averages)
Explicit modeling of:
Electricity procurement and matching structure
Electrolyzer utilization impacts on LCOH
Realized 45V credit value under tier proximity
Grey hydrogen modeled as a delivered cost benchmark, not a theoretical SMR minimum
Scenario vs sensitivity treatment: Matching strategy, electrolyzer type, and grey benchmark are discrete scenarios; electricity price and capacity factor are sensitivities within each scenario.
Results reflect parametric sweeps across the stated ranges (1,500+ scenario combinations covering 6 electricity price points x 14 capacity factor values x 3 matching strategies x 2 electrolyzer types x 3 grey benchmarks), filtered to illustrate dominance patterns and parity threshold behaviors. Results are illustrative of economic boundaries, not exhaustive optimization.
Method
Appendix A: Modeling Parameters
Matching Strategy Configurations
Strategy
Adders ($/kWh)
Loss Fraction
Basis
Annual matched, non-firmed
$0.005
3%
PPA shaping + scheduling costs
Hourly matched, non-firmed
$0.010
3%
Intra-hour balancing + congestion exposure
Hourly matched, firmed w/ backup
$0.025
5%
Battery/grid firming + round-trip losses
Adders reflect incremental procurement costs beyond nominal PPA price. Loss fractions represent transmission, conversion, and utilization inefficiencies.
Low-cost SMR with $3.00/MMBtu natural gas, no carbon capture (U.S. Gulf Coast baseline)
Mid
$1.70
U.S. industrial average delivered cost, 2024-2025 (DOE Hydrogen Program Record 21006)
High
$2.50
Merchant delivered, non-captive, or high-natural-gas-price regions
Sources: DOE Hydrogen Program Records, IEA Global Hydrogen Review 2024, proprietary market analysis. Natural gas pricing as of Q4 2025. Grey benchmarks are reference cases, not forecasts; treated as scenario variants.
ASTM E3200-compliant TEA with ISO 14040/14044 LCA integration
Discount rate
7% real (project finance baseline)
Project lifetime
30 years
All analyses conform to benchmark-anchored validation protocols as described in Insight Quantix TEA-LCA Engine documentation. CAPEX and OPEX assumptions align with NREL 2024 electrolytic hydrogen cost models (adjusted for 2025 learning curves).
Inputs table: Appendix A (benchmarks + author assumptions labeled; scenario vs sensitivity classified)
Reproducibility note: Parity boundaries are most sensitive to delivered power adders, capacity factor assumptions, and credit tier eligibility; changes to these inputs will shift decision regions.
Disclosure: Insight Quantix derived all analytical conclusions independently; references provide context only.
Policy validity: 45V rule interpretation and cliff mapping valid as of February 22, 2026.
Professional Inquiry (Capital / Diligence)
For project-specific diligence deliverables, use the professional path below:
Open intake form | Email directly
Academic Correspondence
For academic correspondence regarding this analysis and assumptions:
Academic contact: jamie@insightquantix.com
Full methodology documentation, sensitivity parameter sets, and benchmark validation protocols are available upon request for academic collaboration or peer review.
Gomez, J. (2026). Hydrogen: 45V cost parity vs grey -A techno-economic analysis of electricity procurement, electrolyzer utilization, and credit-tier risk under U.S. 45V rules (Insight Quantix Analytical Note IQ-AN-H2-45V-2026-01, v1.9). Retrieved from https://insightquantix.com/insights/45v-hydrogen-cost-parity-electricity-price
Chicago Format
Gomez, Jamie. "Hydrogen: 45V Cost Parity vs Grey -A Techno-Economic Analysis of Electricity Procurement, Electrolyzer Utilization, and Credit-Tier Risk under U.S. 45V Rules." Insight Quantix Analytical Note IQ-AN-H2-45V-2026-01, v1.9, March 2026. https://insightquantix.com/insights/45v-hydrogen-cost-parity-electricity-price.
BibTeX
@techreport{Gomez2026_H2_45V,
  author = {Gomez, Jamie},
  title = {Hydrogen: 45V Cost Parity vs Grey},
  institution = {Insight Quantix},
  year = {2026},
  type = {Analytical Note},
  number = {IQ-AN-H2-45V-2026-01},
  month = feb,
  url = {https://insightquantix.com/insights/45v-hydrogen-cost-parity-electricity-price}
}
Reference
About the Author
Jamie R. Gomez, Ph.D.
Principal, Insight Quantix
Chemical engineer specializing in decision-grade techno-economic analysis (TEA) and life cycle assessment (LCA) for hydrogen, sustainable aviation fuels, and power-to-liquids pathways. She translates process-level engineering models into cost, emissions, and uncertainty insights that inform capital allocation and technology scale-up decisions. Her prior work has supported technology cost-target modeling, scale-up analysis, and decision-oriented TEA/LCA efforts across federally funded clean-energy programs, including collaborations with Sandia National Laboratories, the National Renewable Energy Laboratory, ARPA-E, and clean-energy companies. She holds a PhD in chemical engineering with research focused on electrochemical materials fabrication.
Insight Quantix publishes independent analytical work for transparency and decision clarity. The analysis examines benchmark-anchored, audit-defensible economic risk conditions relevant to capital allocation decisions in the $10M-$500M range.
Validation Methodology: ASTM E3200 | ISO 14040/14044 | NREL benchmark-anchored Engine Documentation: Available upon request Website:insightquantix.com
Legal Disclaimer This analytical note is provided for informational and educational purposes only and does not constitute investment advice, financial advice, engineering design recommendations, or legal interpretation of tax policy. Readers should conduct independent due diligence and consult qualified professionals before making capital allocation decisions. The analysis reflects representative scenarios based on stated modeling parameters and should not be construed as a guarantee of project performance or economic outcomes. Specific project economics require site-specific analysis accounting for local conditions, technology configurations, and regulatory environments. Insight Quantix makes no warranties, express or implied, regarding the accuracy, completeness, or reliability of this information for any particular purpose.