When cheap lipids disappear, how quickly does HEFA-SAF parity fail?
Most techno-economic results are conditionally true and operationally unattainable without constraint validation.
DG-PFF Application Marker
- Parity condition: MSP_HEFA <= delivered fossil benchmark.
- Viability region: Imported from Product A parity boundary and tested for persistence under distributional stress.
- Fragility quantified: Figure 2 reports parity probability and Figure 3 maps viability-region collapse.
- Collapse threshold: Deterministic collapse at ~$931/tonne (base jet, modeled credit); at $1200/tonne, residual shortfall is ~$0.162/gal even at maximum modeled credit.
- Parity persistence rule: Parity without persistence is not viability.
Product A: Decision Brief (3-Minute Screen)
Decision Summary
DG-PFF Execution Trace
- Parity condition defined against delivered fossil benchmark.
- Product A viability region imported from the parity boundary and stress-tested.
- Fragility quantified using parity probability response and collapse mapping.
- Collapse threshold identified at feedstock breach points with explicit residual gap.
- Go/No-Go exposure classes produced for procurement and credit regimes.
Core decision question
What is the probability that HEFA-SAF retains parity when feedstock prices move from optimistic assumptions to realistic procurement ranges?
Decision owner and timing
- Decision owner: Project developer / lender downside case team / investment committee.
- Decision timing: Prior to feedstock strategy lock, term-sheet finalization, or FID.
Analytical lens (DG-PFF)
- Parity condition: MSP_HEFA <= delivered fossil jet benchmark.
- Fragility condition: parity persistence under feedstock-price distribution shifts.
- Decision principle: Parity alone is insufficient; viability requires persistence of parity under perturbation. SAF economics are governed by feedstock cost and policy realization, not conversion efficiency. Breaches of feedstock and policy boundaries are classified as the Feedstock-Policy Constraint Regime.
Required outputs (non-negotiable)
- Lipid-price distribution used in screening
- Parity probability
P(MSP <= jet)across distribution - Collapse threshold where parity disappears
- Invalidation map of parity-defined viable region
- Structured Go/No-Go output for procurement strategy
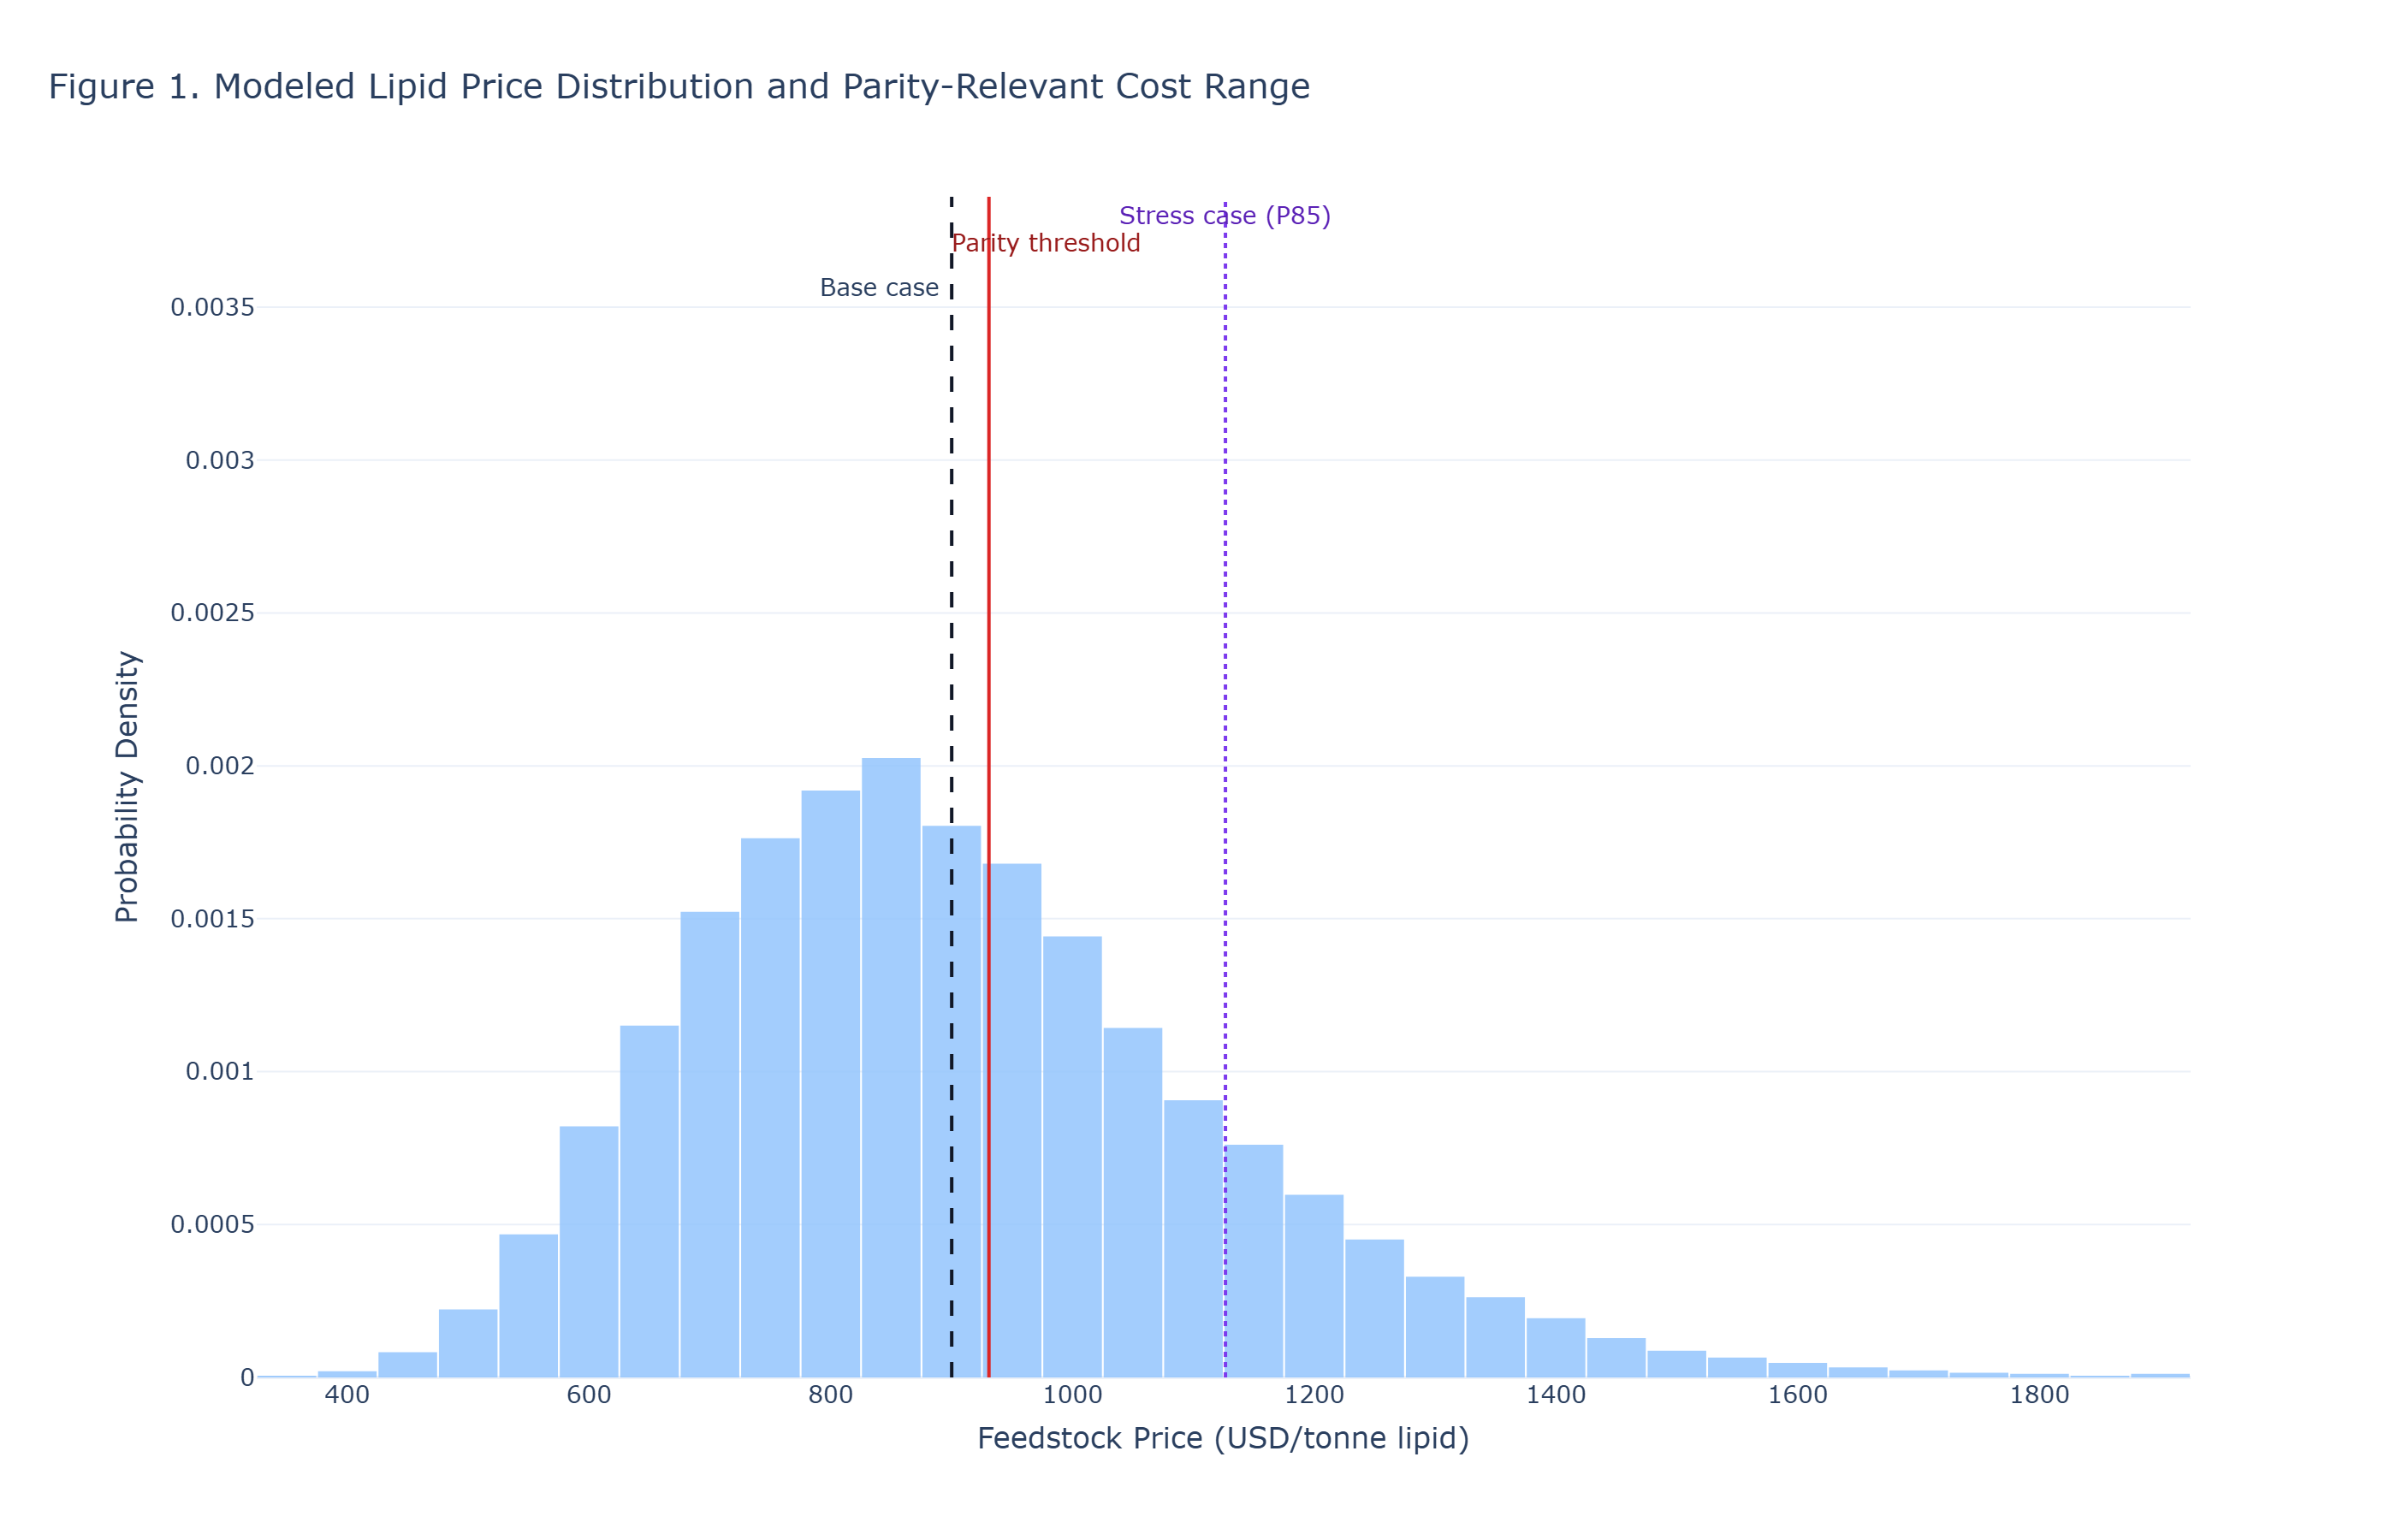
Figure 1 - Lipid Price Distribution
Required form
- Empirical or scenario distribution of lipid prices used for screening.
- Must include source basis and recency date.
Decision statement
- Under the modeled distribution, ~60.1% of feedstock outcomes remain below the parity-supporting threshold (~$931/tonne).
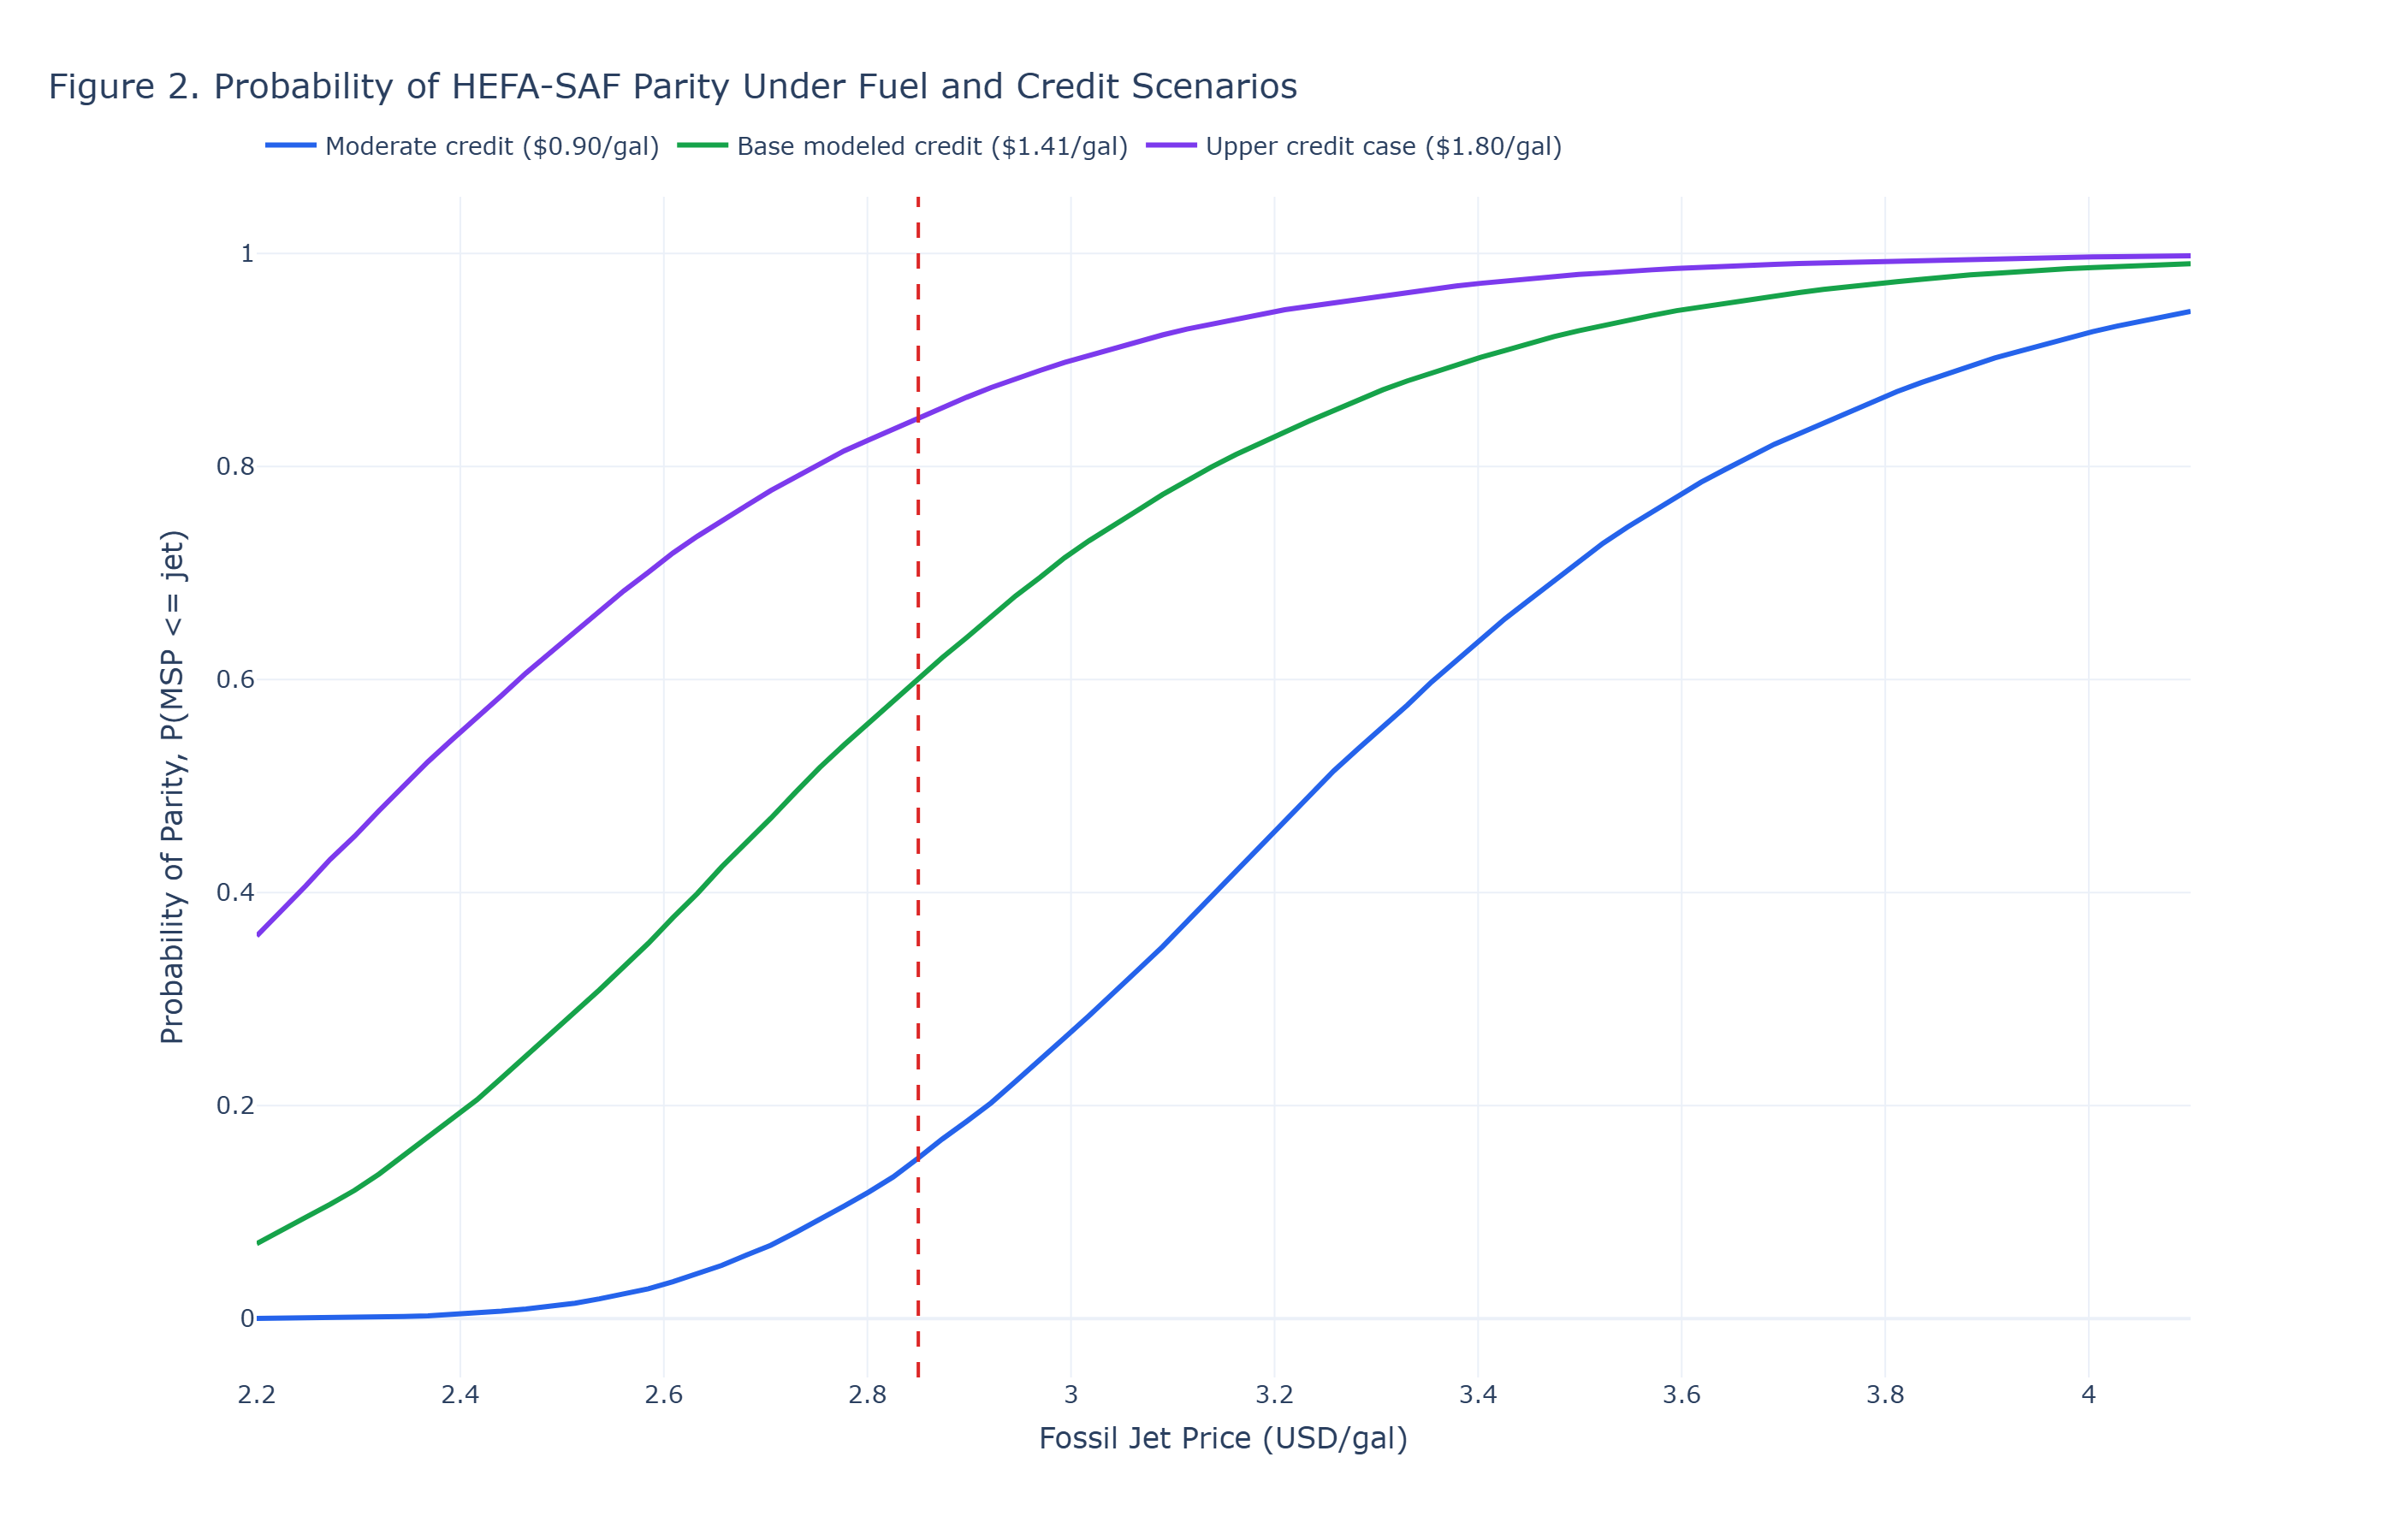
Figure 2 - Parity Probability
Required form
P(MSP <= jet)under base and stressed credit assumptions.
Decision statement
- Under base modeled credit assumptions, parity probability is ~60.1%; under moderate-credit stress it falls to ~15.0% (a 45.1 percentage-point collapse in parity persistence).
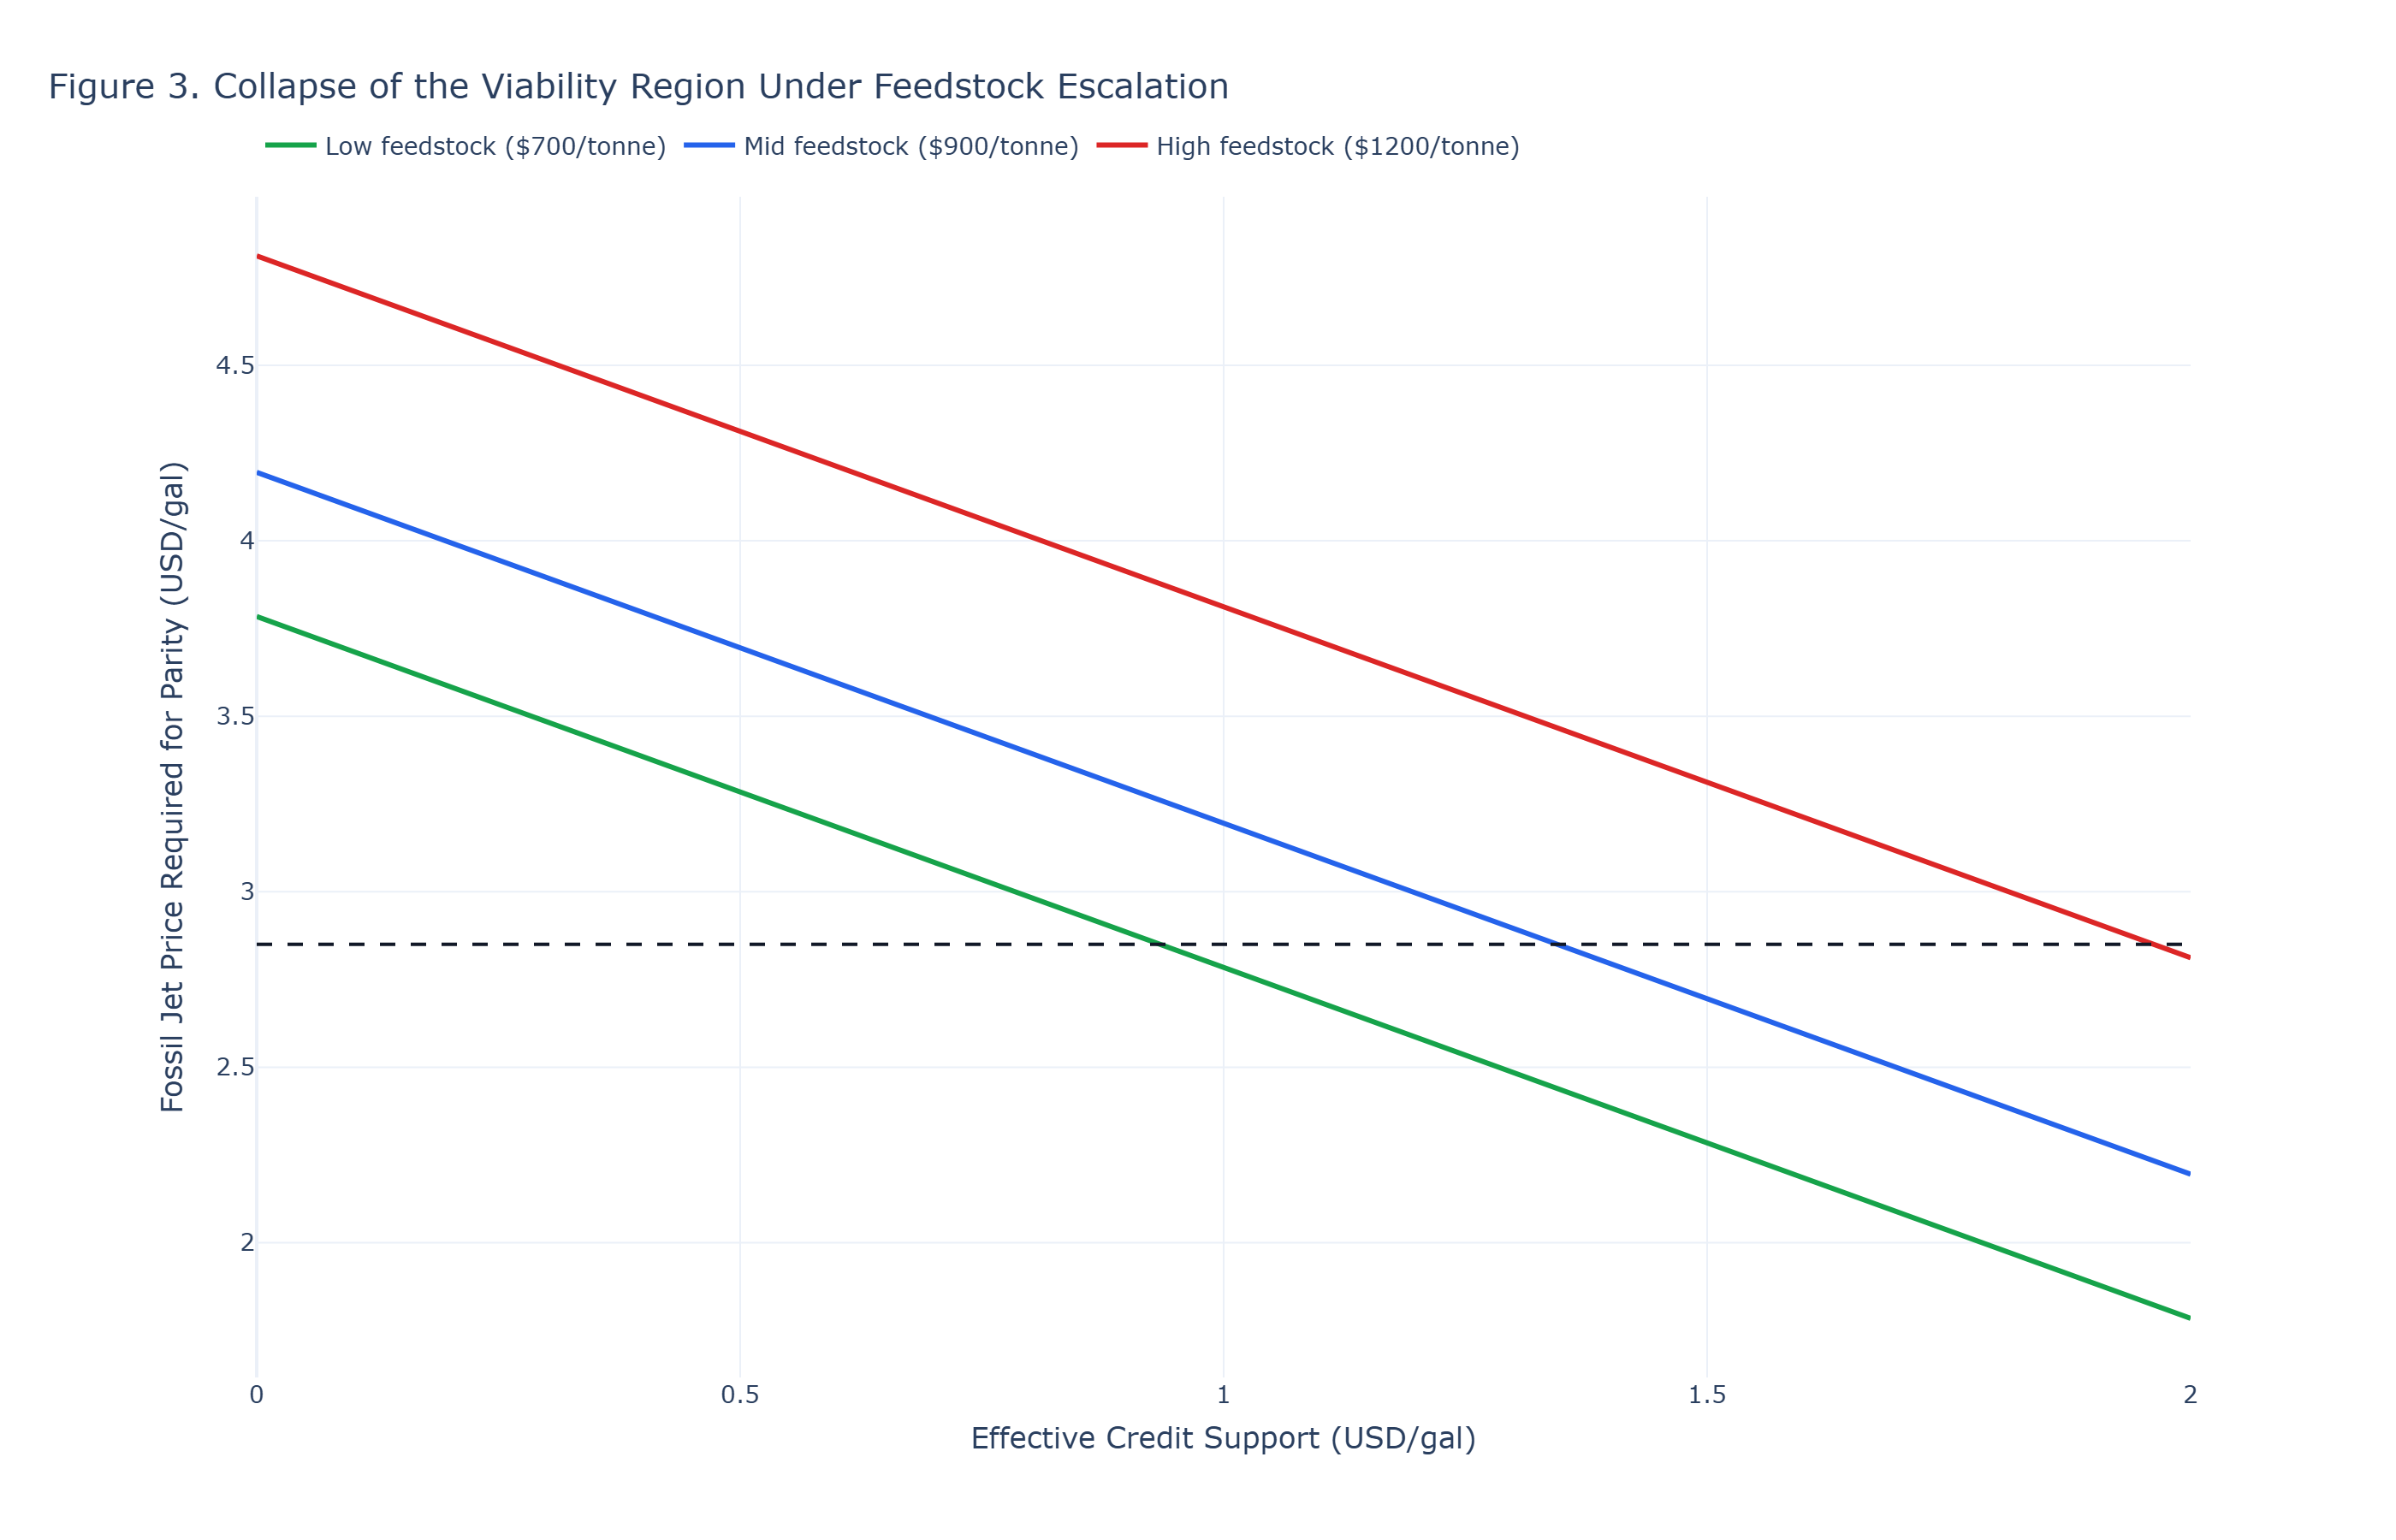
Figure 3 - Collapse Threshold
Required form
- Feedstock price threshold above which parity is no longer observed.
Decision statement
- Above ~$931/tonne (base jet, modeled credit), parity collapses for the deterministic boundary case. At $1200/tonne feedstock, even maximum modeled credit leaves an unrecovered shortfall of ~$0.162/gal.
- As low-cost lipid supply tightens, the cost basis shifts upward, eliminating parity even if conversion efficiency remains unchanged.
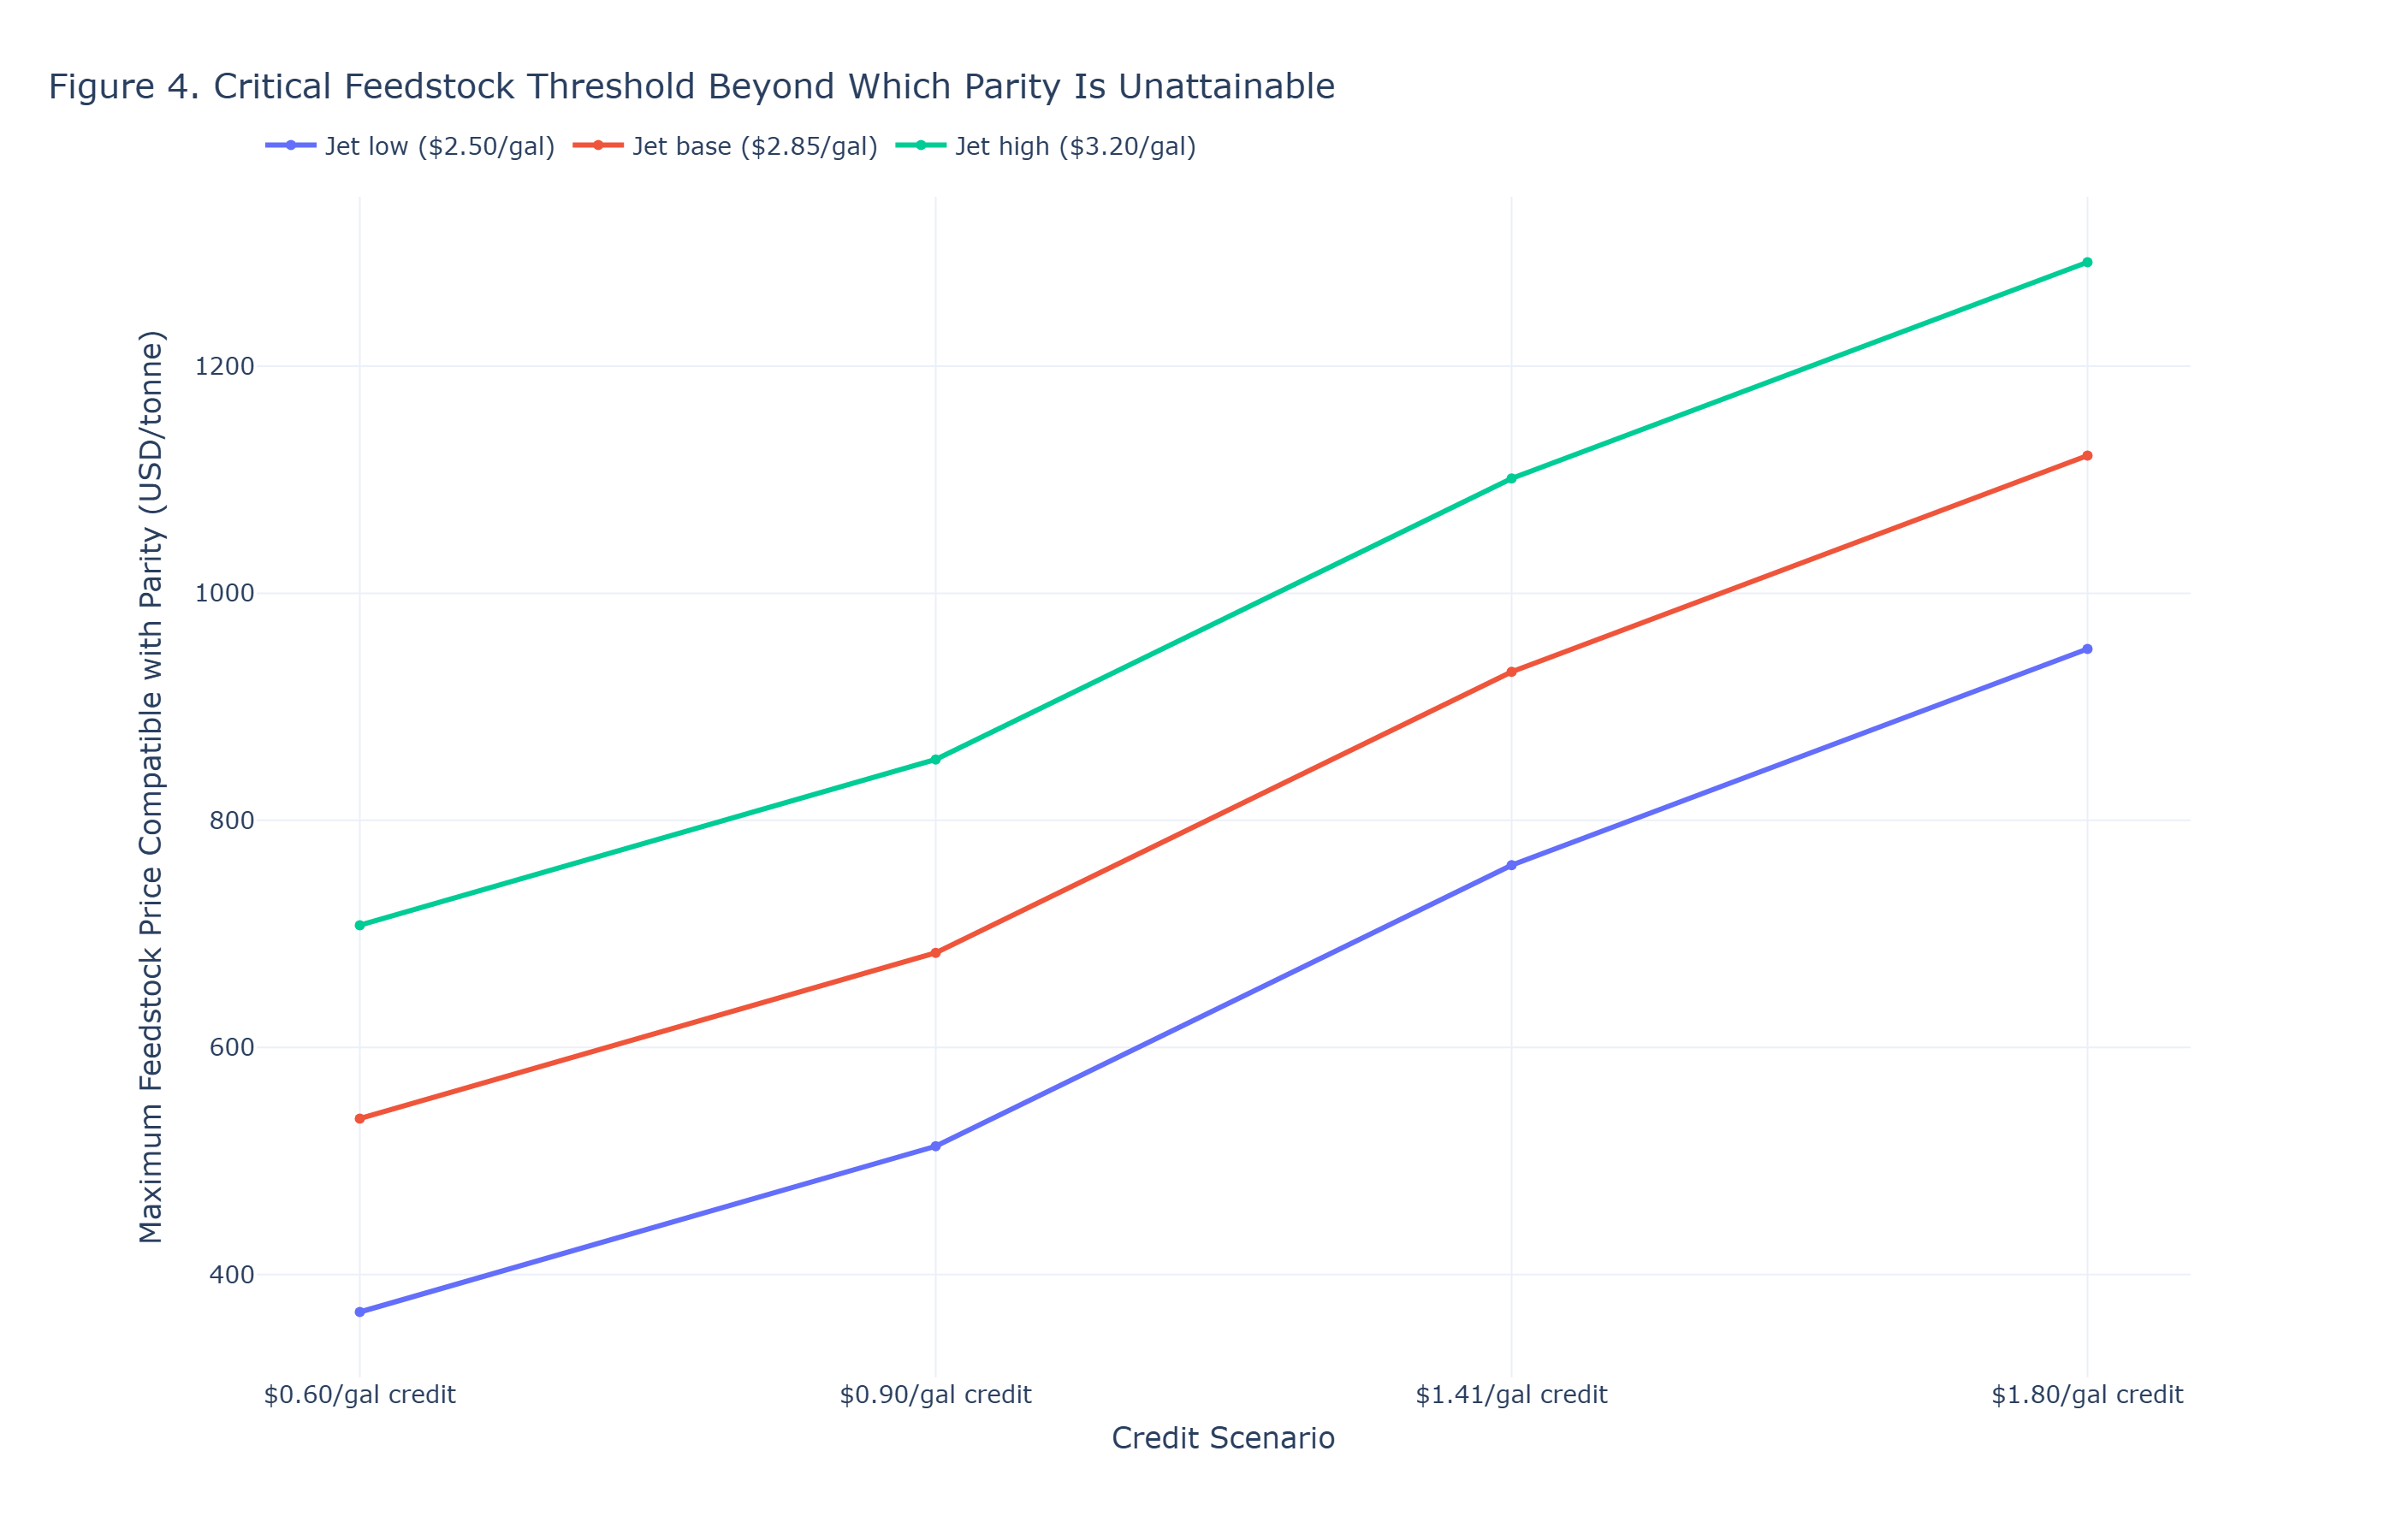
Figure 4 - Fragility Trigger Threshold
Required form
- Critical feedstock threshold by credit scenario (and at least one jet-price scenario cross-check).
Decision statement
- At base jet benchmark, the parity boundary requires feedstock <= ~$931/tonne under modeled credit support; above this collapse threshold, parity is unattainable without structural redesign.
Figure 5 - Decision Exposure Matrix
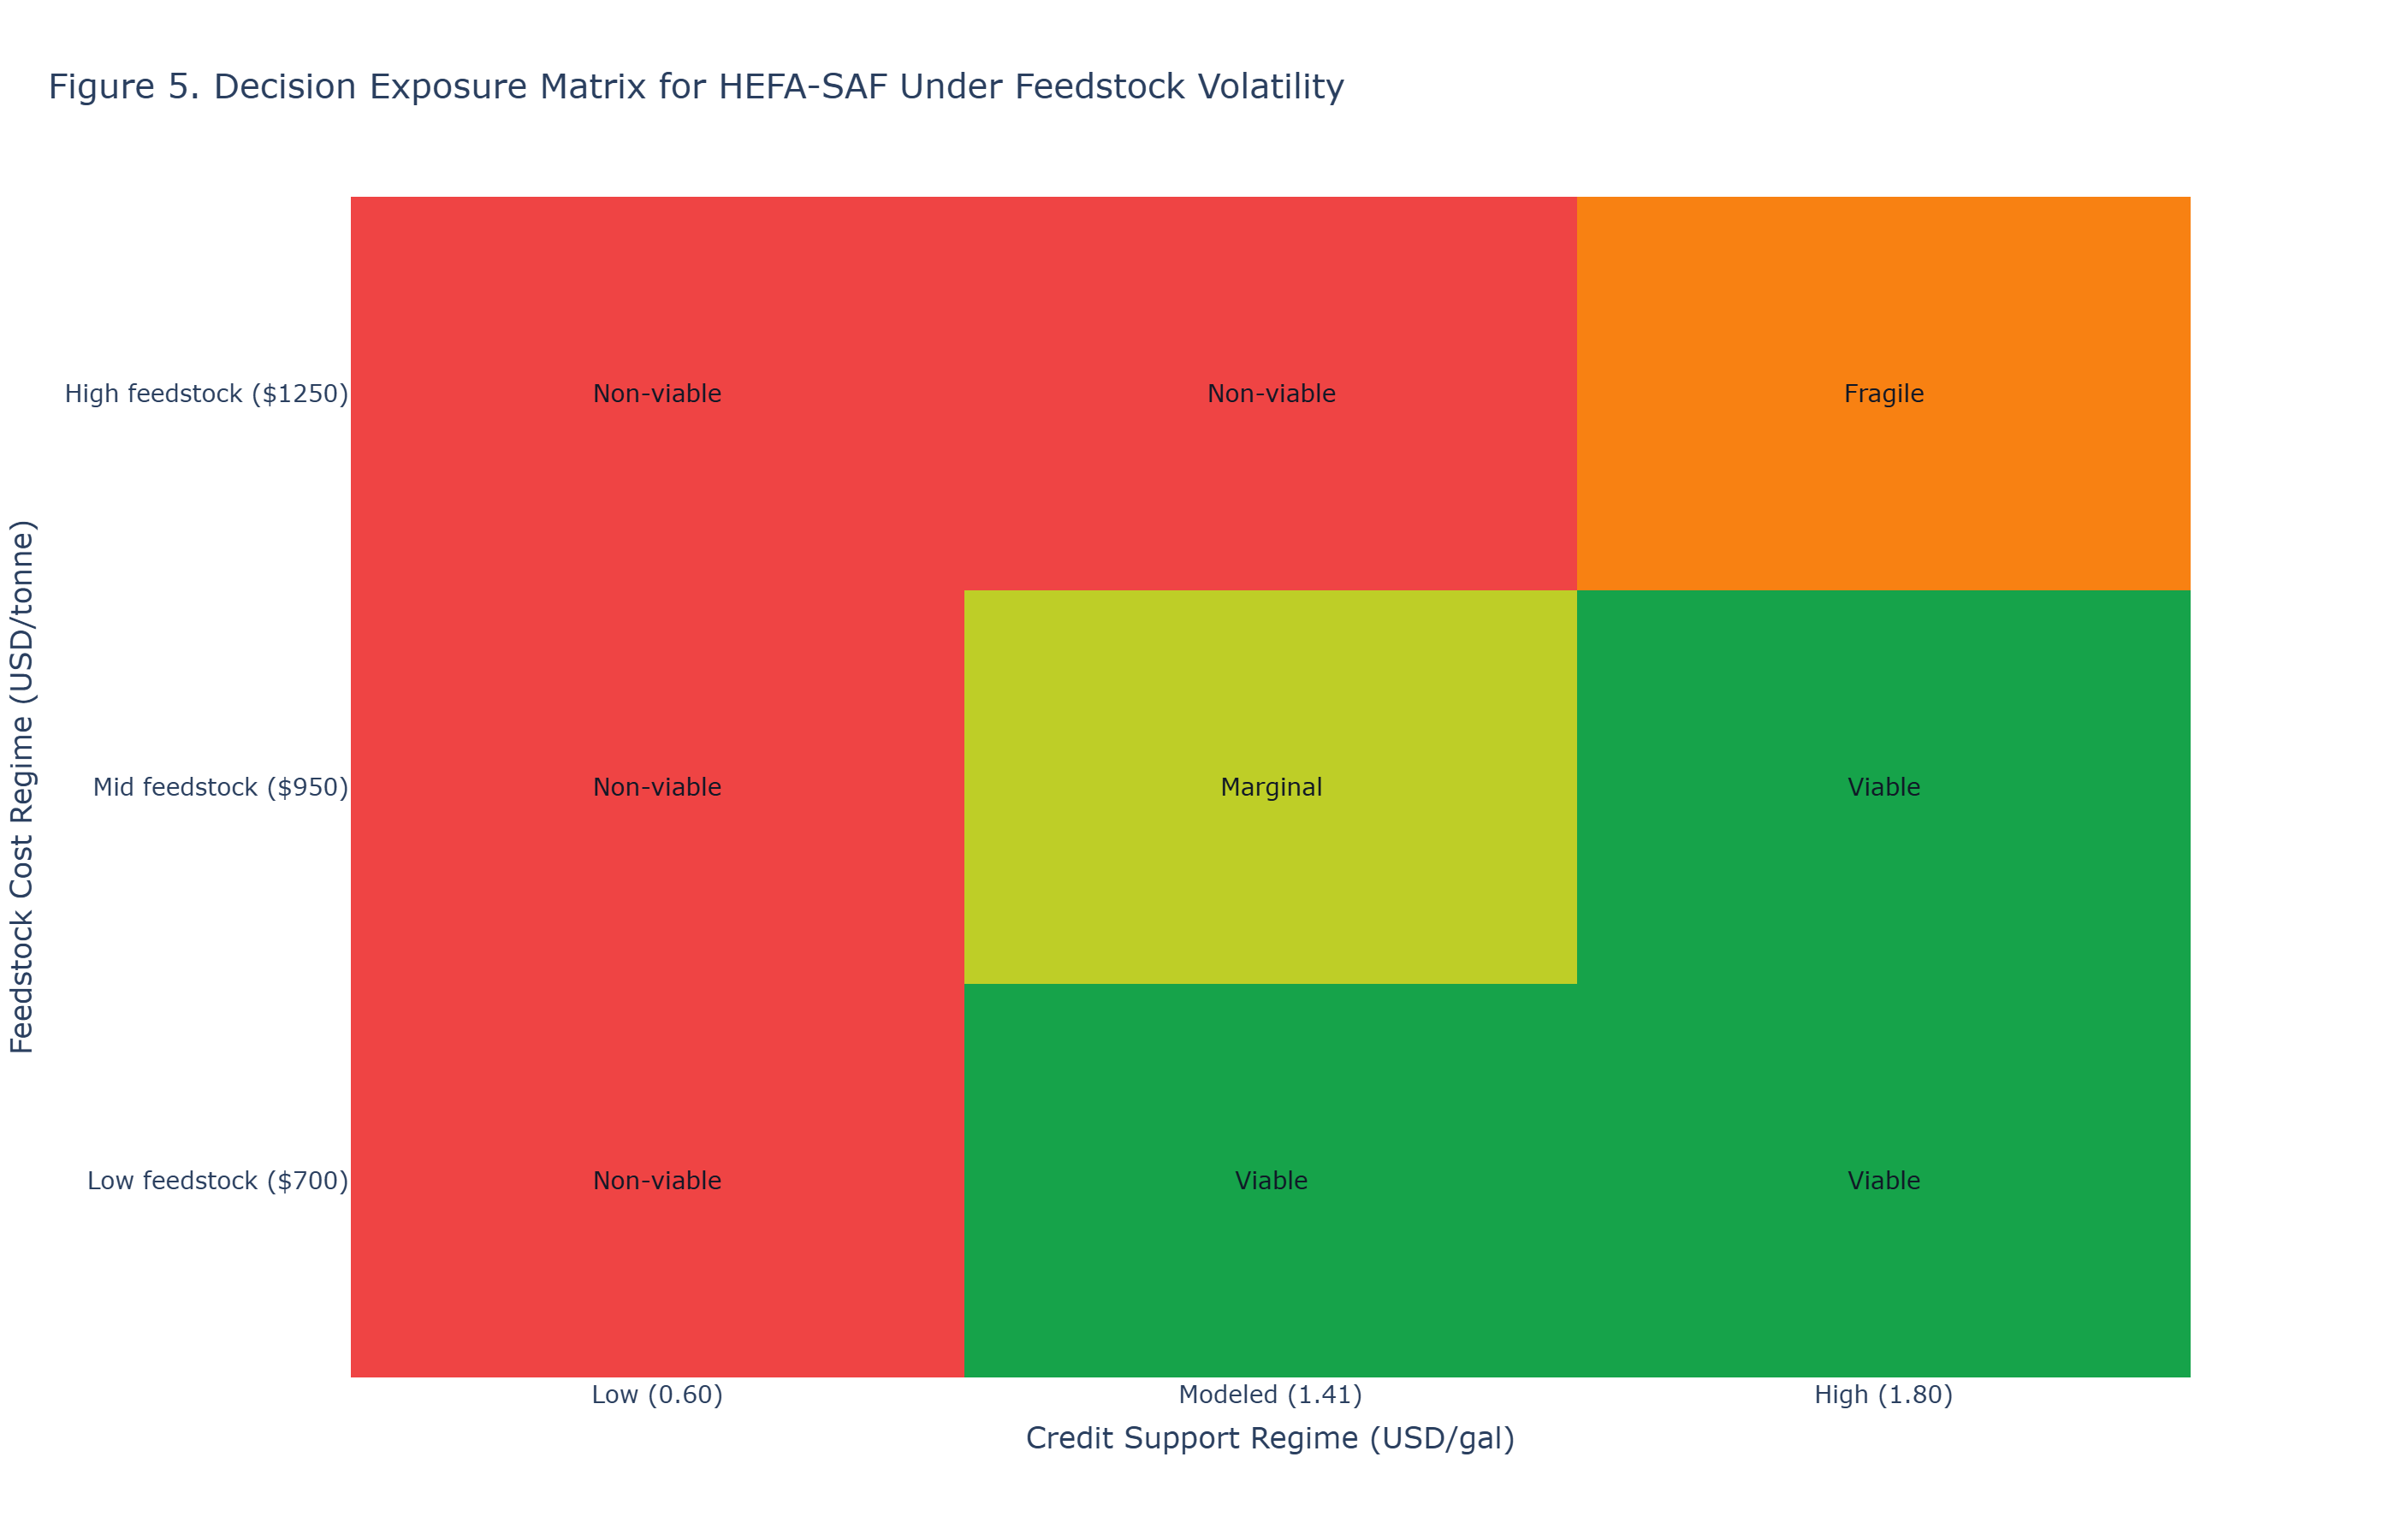
Required form
- 2x2 or 3x3 exposure matrix with explicit regime labels and decision class.
Decision statement
- Under high-feedstock / low-credit regimes, parity status is No-Go.
Structured Go/No-Go Output
| Status | Trigger condition | Decision handling |
|---|---|---|
| Go | Parity gap <= -$0.15/gal and parity probability remains high under base assumptions | Proceed to diligence with standard procurement and policy controls. |
| Conditional Go | Parity gap > -$0.15 and <= +$0.05/gal; parity persistence weakens under plausible perturbation | Proceed only with explicit procurement and policy-risk mitigation. |
| Rework | Parity gap > +$0.05 and <= +$0.30/gal | Redesign structure or defer pending feedstock and credit improvement. |
| No-Go | Parity gap > +$0.30/gal or collapse threshold breached | Do not proceed under current feedstock-policy configuration. |
Hard boundary: Above ~$931/tonne feedstock in the base-jet modeled-credit case, parity cannot be restored through process optimization once realistic policy uncertainty is included.
SAF Constraint Table (Fragility Boundary)
| Variable | Threshold | Outcome |
|---|---|---|
| Feedstock price | > ~$931/tonne (base jet, modeled credit) | Parity persistence fails. |
| Policy realization | Effective credit < ~$1.35/gal | Viability region collapses. |
| Hydrogen cost (embedded process basis) | +~$0.25/gal equivalent shock | Feedstock collapse threshold tightens by ~122/tonne. |
| Feedstock availability / competition | Distribution mass shifts above parity-supporting range | Case enters Feedstock-Policy Constraint Regime. |
SAF No-Free-Lunch Condition
There is no operating regime where low feedstock cost, high availability, minimal competition, and full policy realization are simultaneously achievable.
Current regime highlights from Figure 5:
- Low feedstock / low credit: No-Go
- Mid feedstock / modeled credit: Conditional Go
- High feedstock / high credit: Rework
Constraint Statement (DG-PFF)
Under realistic lipid-price distributions, HEFA-SAF parity persistence is fragile: once feedstock exceeds the ~$931/tonne collapse threshold, the viability region contracts sharply, and at ~$1200/tonne parity remains unattainable even with maximum modeled credit.
Once realistic feedstock pricing and policy uncertainty are introduced, the apparent SAF parity region contracts significantly. Cases in this state should be classified as the Feedstock-Policy Constraint Regime and treated as non-viable for decision-grade progression.
Product B: Technical Note (Audit Trail)
1. Decision Context
This note is a Product B fragility-first application of DG-PFF for HEFA-SAF. It evaluates whether parity remains bankable once feedstock uncertainty is represented explicitly.
2. Analytical Lens (DG-PFF)
- Parity condition: MSP_HEFA <= fossil benchmark.
- Fragility condition: collapse of parity probability under feedstock escalation.
- Required relationship: this note must explicitly invalidate portions of Product A parity region under realistic market conditions.
3. Parity Claim Under Distribution
The tested claim is that a parity-positive HEFA case remains decision-grade once feedstock-price uncertainty is represented as a distribution rather than a point estimate.
4. Fragility Metric
Fragility is quantified as:
- Decline rate of parity probability per feedstock-price shift, and
- Collapse threshold where parity probability approaches zero.
5. Parity-Fragility Relationship
This fragility note explicitly invalidates parity-defined viable regions from Product A when feedstock outcomes exceed collapse thresholds, even if other assumptions remain favorable.
6. Decision Classification Bands
Decision-matrix classes are based on parity-gap bands (MSP - fossil benchmark):
- Go: <= -$0.15/gal
- Conditional Go: > -$0.15 and <= +$0.05/gal
- Rework: > +$0.05 and <= +$0.30/gal
- No-Go: > +$0.30/gal
Band rationale: these ranges convert continuous parity gaps into decision actions for screening, term-sheet diligence, and downside-case governance.
6A. Distribution Source and Methodology
- Distribution type: lognormal synthetic feedstock-price distribution.
- Parameterization: centered around base feedstock assumption ($900/tonne) with
sigma=0.24. - Reproducibility controls: random seed fixed at
42; distribution clipped to [$350, $1900]/tonne. - Data and traceability artifacts:
assets/data/notes/hefa-feedstock-risk-when-cheap-lipids-disappear/feedstock_distribution_samples.csvassets/data/notes/hefa-feedstock-risk-when-cheap-lipids-disappear/hefa_feedstock_fragility_summary.jsonscripts/generate_hefa_feedstock_fragility_figures.py
6B. Parity Probability and Collapse Outputs
- Base modeled credit parity probability (at $2.85/gal fossil benchmark): ~60.1%
- Moderate-credit stress parity probability (at $2.85/gal fossil benchmark): ~15.0%
- Deterministic collapse threshold (base jet, modeled credit): ~$931/tonne
- High-feedstock collapse shortfall: at $1200/tonne, residual gap remains ~$0.162/gal even at maximum modeled credit.
7. Publication Completion Checklist
- ✓ Figure 1 feedstock distribution complete with parity threshold marker
- ✓ Figure 2 parity probability curves complete with scenario labels
- ✓ Figure 3 viability-region collapse figure complete with boundary language
- ✓ Figure 4 critical threshold figure complete with units
- ✓ Figure 5 decision exposure matrix complete with regime classes
- ✓ Decision classification bands disclosed and justified
- ✓ Distribution source and methodology disclosed
- ✓ Parity probability outputs complete (base + stress)
- ✓ Collapse threshold disclosed with units and boundary condition
- ✓ Invalidation map included with labeled thresholds
- ✓ Structured Go/No-Go output included
- ✓ Cross-link to parity note and DG-PFF standard included
This analysis applies the Decision-Grade Parity–Fragility Framework (DG-PFF), developed by Insight Quantix. This note identifies both parity conditions and the fragility thresholds under which those conditions fail. This analysis extends DG-PFF beyond hydrogen systems, demonstrating applicability to SAF pathways under feedstock-driven cost uncertainty.
Learn more -> Companion parity note ->
Citation Readiness & Reproducibility
- Publication date & version: March 2026 | v1.0
- Canonical URL: https://insightquantix.com/insights/hefa-feedstock-risk-when-cheap-lipids-disappear/
- Inputs and thresholds: See distribution assumptions, collapse outputs, and linked artifacts in
assets/data/notes/hefa-feedstock-risk-when-cheap-lipids-disappear/. - Reproducibility note: Fragility outputs are most sensitive to feedstock distribution shape, effective credit realization, and collapse-threshold assumptions.
- Disclosure: Insight Quantix derived all analytical conclusions independently; external references provide context only.
How to Cite This Analytical Note
APA Format
Gomez, J. R. (2026). HEFA Feedstock Risk: When Cheap Lipids Disappear (Insight Quantix Analytical Note IQ-AN-SAF-2026-02, v1.0). Retrieved from https://insightquantix.com/insights/hefa-feedstock-risk-when-cheap-lipids-disappear/
Chicago Format
Gomez, Jamie R. "HEFA Feedstock Risk: When Cheap Lipids Disappear." Insight Quantix Analytical Note IQ-AN-SAF-2026-02, v1.0, March 2026. https://insightquantix.com/insights/hefa-feedstock-risk-when-cheap-lipids-disappear/.
BibTeX
@techreport{Gomez2026_SAF_Fragility,
  author = {Gomez, Jamie R.},
  title = {HEFA Feedstock Risk: When Cheap Lipids Disappear},
  institution = {Insight Quantix},
  year = {2026},
  type = {Analytical Note},
  number = {IQ-AN-SAF-2026-02},
  month = mar,
  url = {https://insightquantix.com/insights/hefa-feedstock-risk-when-cheap-lipids-disappear/}
}Appendix A: Modeling Parameters
- Model form: See the governing equations and threshold definitions in the technical section of this note.
- Primary data artifacts:
assets/data/notes/hefa-feedstock-risk-when-cheap-lipids-disappear/ - Primary figure artifacts:
assets/img/notes/hefa-feedstock-risk-when-cheap-lipids-disappear/ - Reproducibility scope: This appendix anchors file locations and parameter traceability for decision-grade review.
About the Author
About Insight Quantix
Insight Quantix publishes independent analytical work for transparency and decision clarity. The analysis examines benchmark-anchored, audit-defensible economic risk conditions relevant to capital allocation decisions in the $10M-$500M range.
Validation Methodology: ASTM E3200 | ISO 14040/14044 | NREL benchmark-anchored Engine Documentation: Available upon request Website: insightquantix.com
This analytical note is provided for informational and educational purposes only and does not constitute investment advice, financial advice, engineering design recommendations, or legal interpretation of tax policy. Readers should conduct independent due diligence and consult qualified professionals before making capital allocation decisions. The analysis reflects representative scenarios based on stated modeling parameters and should not be construed as a guarantee of project performance or economic outcomes. Specific project economics require site-specific analysis accounting for local conditions, technology configurations, and regulatory environments. Insight Quantix makes no warranties, express or implied, regarding the accuracy, completeness, or reliability of this information for any particular purpose.
© 2026 Insight Quantix. This analytical note may be cited with proper attribution.