Under current feedstock and credit conditions, when does HEFA-SAF undercut fossil jet at the offtake gate?
Most techno-economic results are conditionally true and operationally unattainable without constraint validation.
DG-PFF Application Marker
- Parity condition: MSP_HEFA <= delivered fossil benchmark.
- Viability region: Mapped explicitly in Figure 2 as the region below the parity boundary.
- Fragility quantified: Figure 4 reports the fragility slope d(MSP)/d(feedstock).
- Collapse threshold: Parity is invalid above feedstock ~$931/tonne (base credit), CI > ~37.4 gCO2e/MJ, or effective credit < ~$1.35/gal.
- Near-degenerate base case: Base feedstock assumption is $900/tonne, only ~$31/tonne (about 3.4%) below the modeled collapse threshold.
- Parity persistence rule: Parity without persistence is not viability.
Product A: Decision Brief (3-Minute Screen)
Decision Summary
Kill-condition snapshot
- Base-case headroom to feedstock collapse is only ~$31/tonne (base $900/tonne vs collapse ~$931/tonne).
- At $1,000/tonne feedstock, parity is invalid in the base-credit case by approximately $0.14/gal.
- Product A is a boundary screen only; pre-FID capital decisions require Product B persistence testing.
SAF economics are governed by feedstock cost and policy realization, not conversion efficiency.
Structured Go/No-Go output
| Status | Trigger condition | Decision handling |
|---|---|---|
| Go | Feedstock <= ~$683/tonne with at least moderate credit support (~$0.90/gal) and no collapse-threshold breach | Proceed to diligence with standard sensitivity disclosure. |
| Conditional Go | Feedstock between ~$683 and ~$931/tonne, with modeled base credit (~$1.41/gal) and no CI/credit collapse-threshold breach | Proceed only with contracted controls and explicit policy-risk diligence. |
| No-Go | Feedstock > ~$931/tonne, or effective credit < ~$1.35/gal, or CI > ~37.4 gCO2e/MJ | Do not proceed under current configuration; redesign, defer, or transfer risk. |
Hard boundary: Above ~$931/tonne feedstock in the modeled base-credit case, parity cannot be restored through process optimization alone. Cases crossing this line enter the Feedstock-Policy Constraint Regime.
SAF Constraint Table (Decision Boundaries)
| Variable | Threshold | Outcome |
|---|---|---|
| Feedstock price | > ~$931/tonne (modeled base-credit case) | Parity fails. |
| Policy realization | Effective credit < ~$1.35/gal | Viability region collapses. |
| Hydrogen cost shock (embedded process basis) | +~$0.25/gal equivalent | Feedstock parity ceiling tightens by ~122/tonne. |
| Feedstock availability / competition | Distribution shifts above parity-supporting feedstock range | Project enters Feedstock-Policy Constraint Regime. |
SAF No-Free-Lunch Condition
There is no operating regime where low feedstock cost, high availability, minimal competition, and full policy realization are simultaneously achievable.
DG-PFF Execution Trace
- Parity condition defined against delivered fossil benchmark.
- Viability region mapped using the Figure 2 parity boundary.
- Fragility quantified using the Figure 4 marginal parity penalty.
- Collapse thresholds identified for feedstock, CI, and effective credit.
- Go/No-Go decision handling produced in the decision summary outputs.
Decision question
At what production cost, carbon-intensity, and credit-realization combinations does HEFA-SAF beat fossil jet at the offtake gate?
Decision owner and deadline
- Decision owner: Investor / strategy lead / policy analyst
- Decision deadline: Prior to feedstock contracting, JV economics lock, or scale-up capital commitment.
Applicability
This note applies a structural feasibility screen for HEFA-SAF parity against fossil jet. It is designed for pre-FID and portfolio screening where go/no-go boundaries are required. As a decision rule: Product A alone is a screening filter, not a standalone investment decision basis; pre-FID capital decisions require the companion Product B fragility note.
Analytical lens (DG-PFF)
- Parity condition: MSP_HEFA <= fossil jet price on a delivered basis.
- Fragility condition: MSP_HEFA sensitivity to lipid price ($/tonne), effective credit value ($/gal), and CI-linked credit compression.
- Framework principle: Parity alone is insufficient; viability requires persistence of parity under perturbation.
Dominant control variables
- Primary controls: Feedstock price and realized credit value govern whether parity is achievable.
- Secondary modifiers: CI and hydrogen cost determine whether the required credit regime is realistically accessible.
- Hard boundary rule: Above ~$931/tonne feedstock in the modeled base-credit case, HEFA-SAF parity is not achievable.
Confidence / robustness tag
Confidence: Medium (benchmark-anchored deterministic sweep; dispatch, contracting, and full LCA coupling not yet integrated), benchmark run dated March 20, 2026.
Primary outputs (non-negotiable)
- Benchmark framing figure
- Primary parity map
- MSP response curve with parity threshold
- Fragility penalty figure
- Decision summary figure
Figure 1 - Benchmark Framing
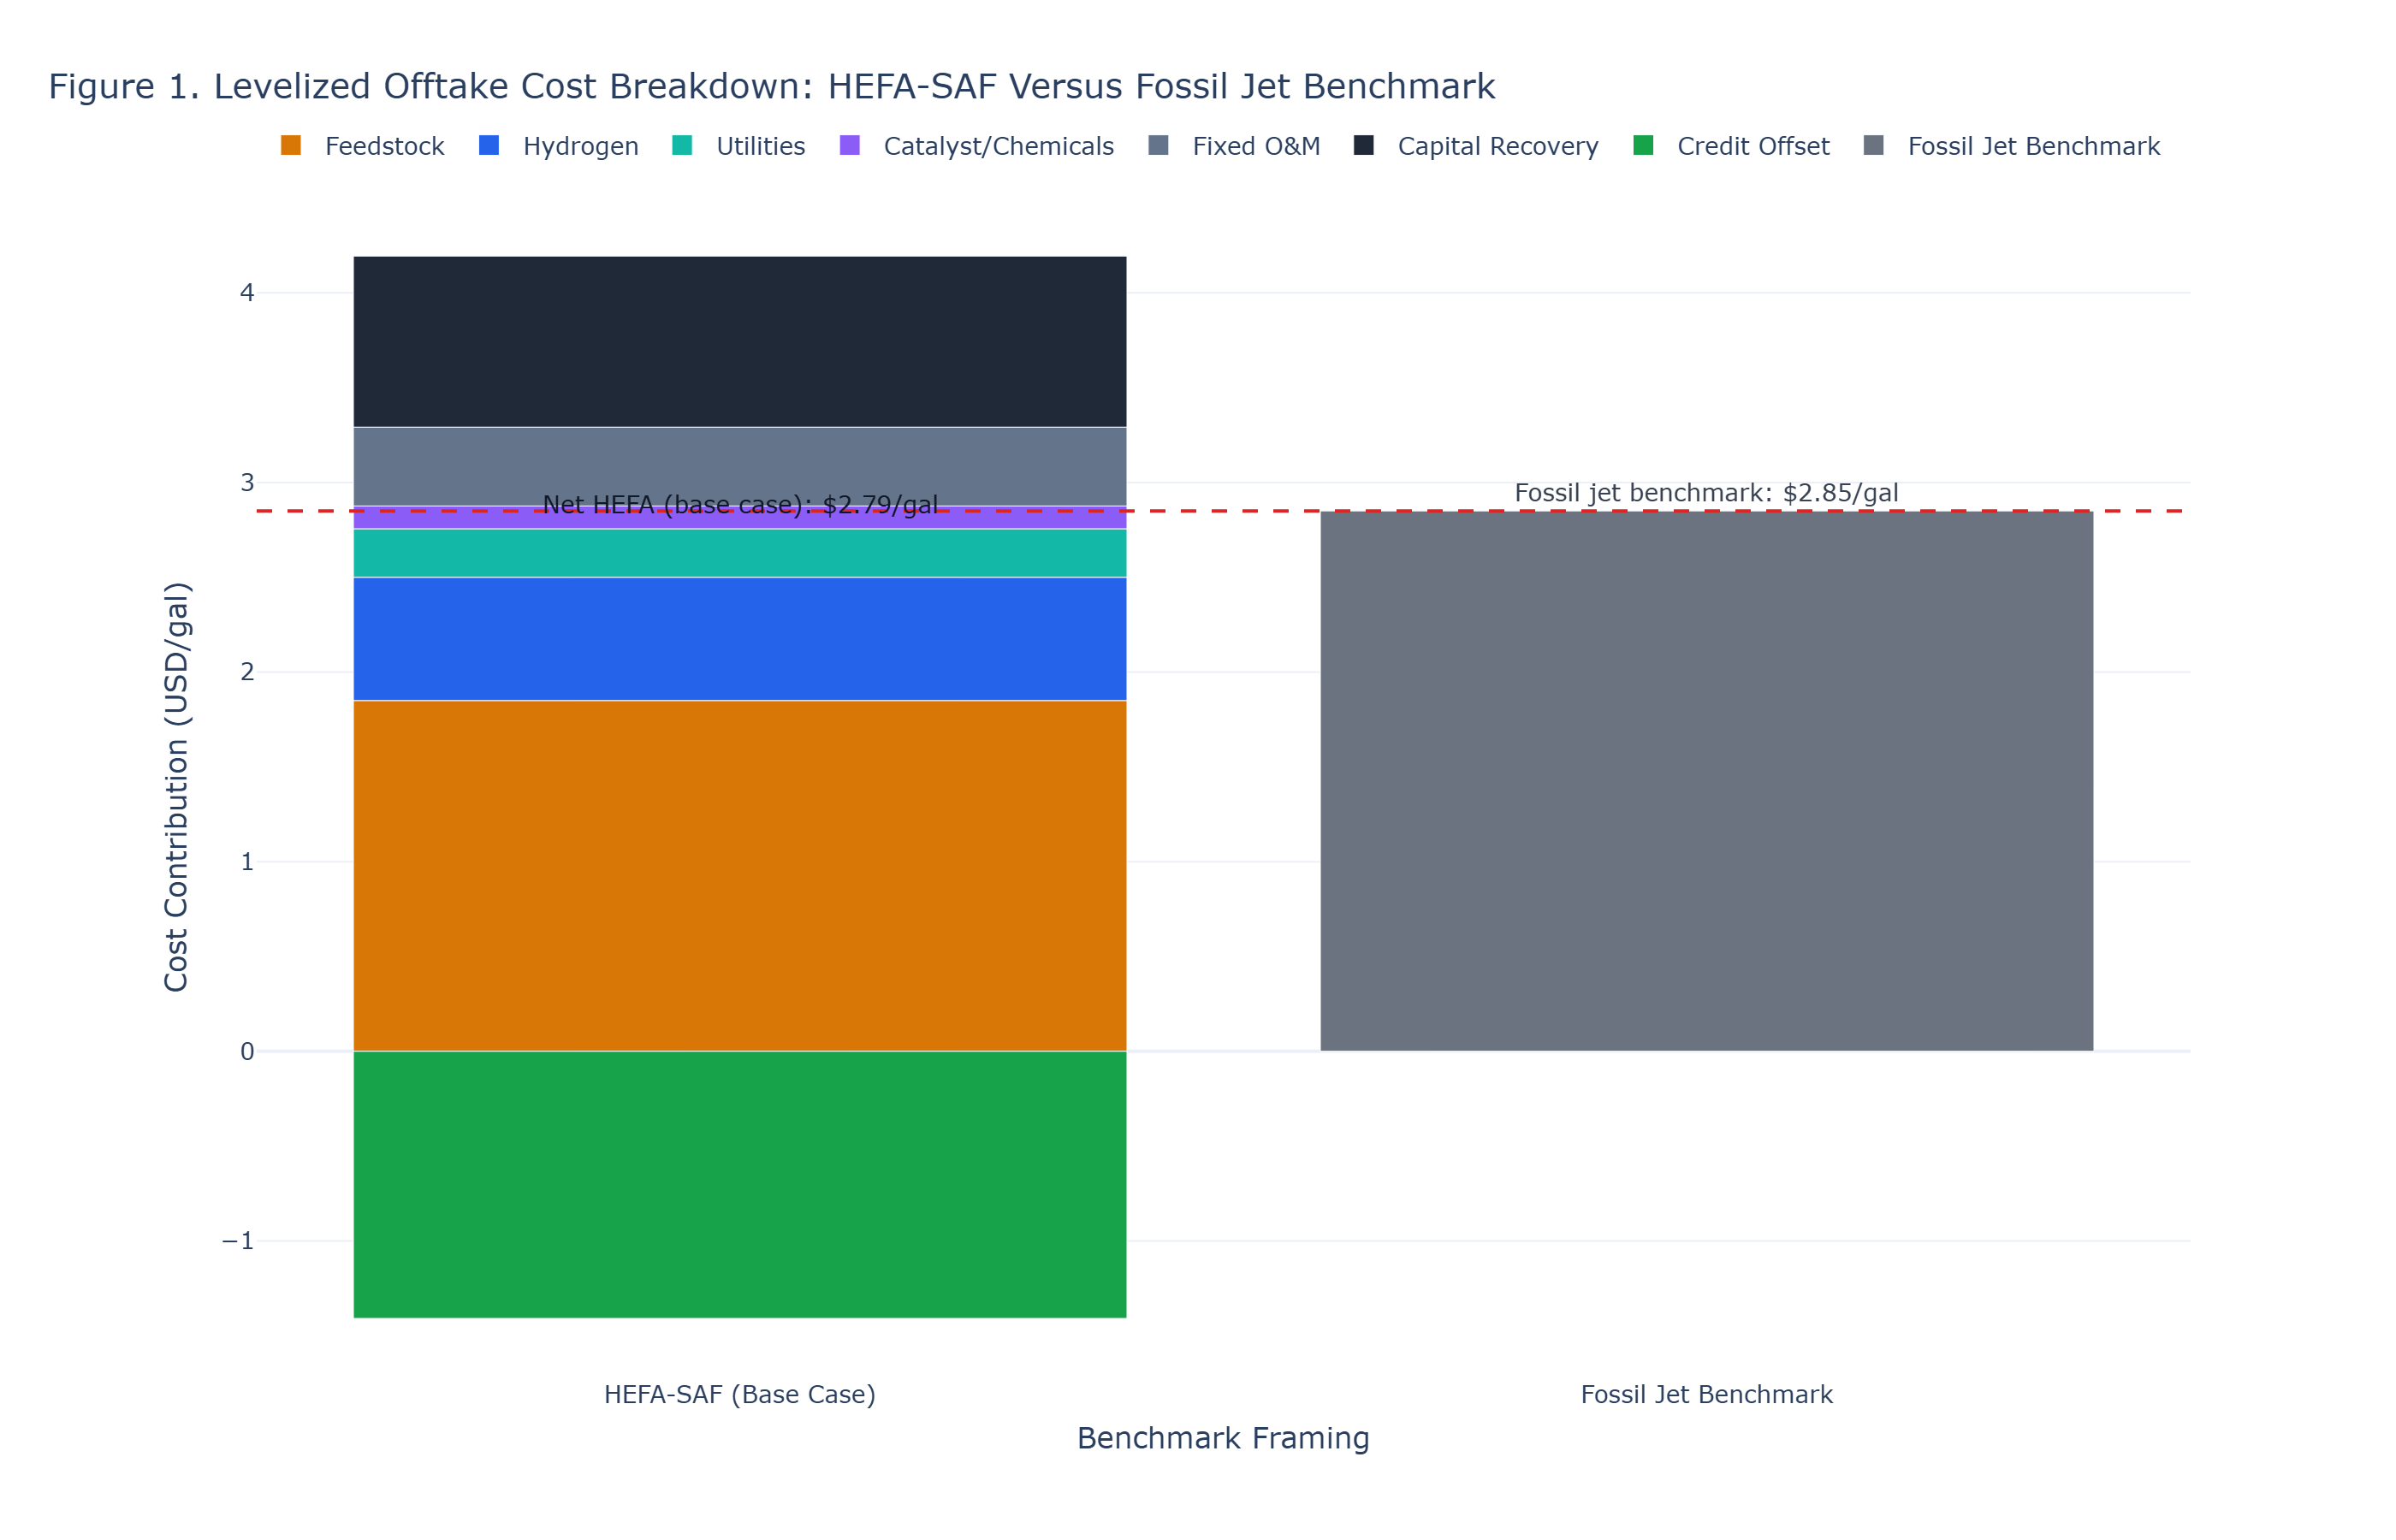
Decision statement
- In the base case, HEFA parity requires near-threshold feedstock pricing and fails quickly under moderate feedstock escalation.
Figure 2 - Primary Parity Map
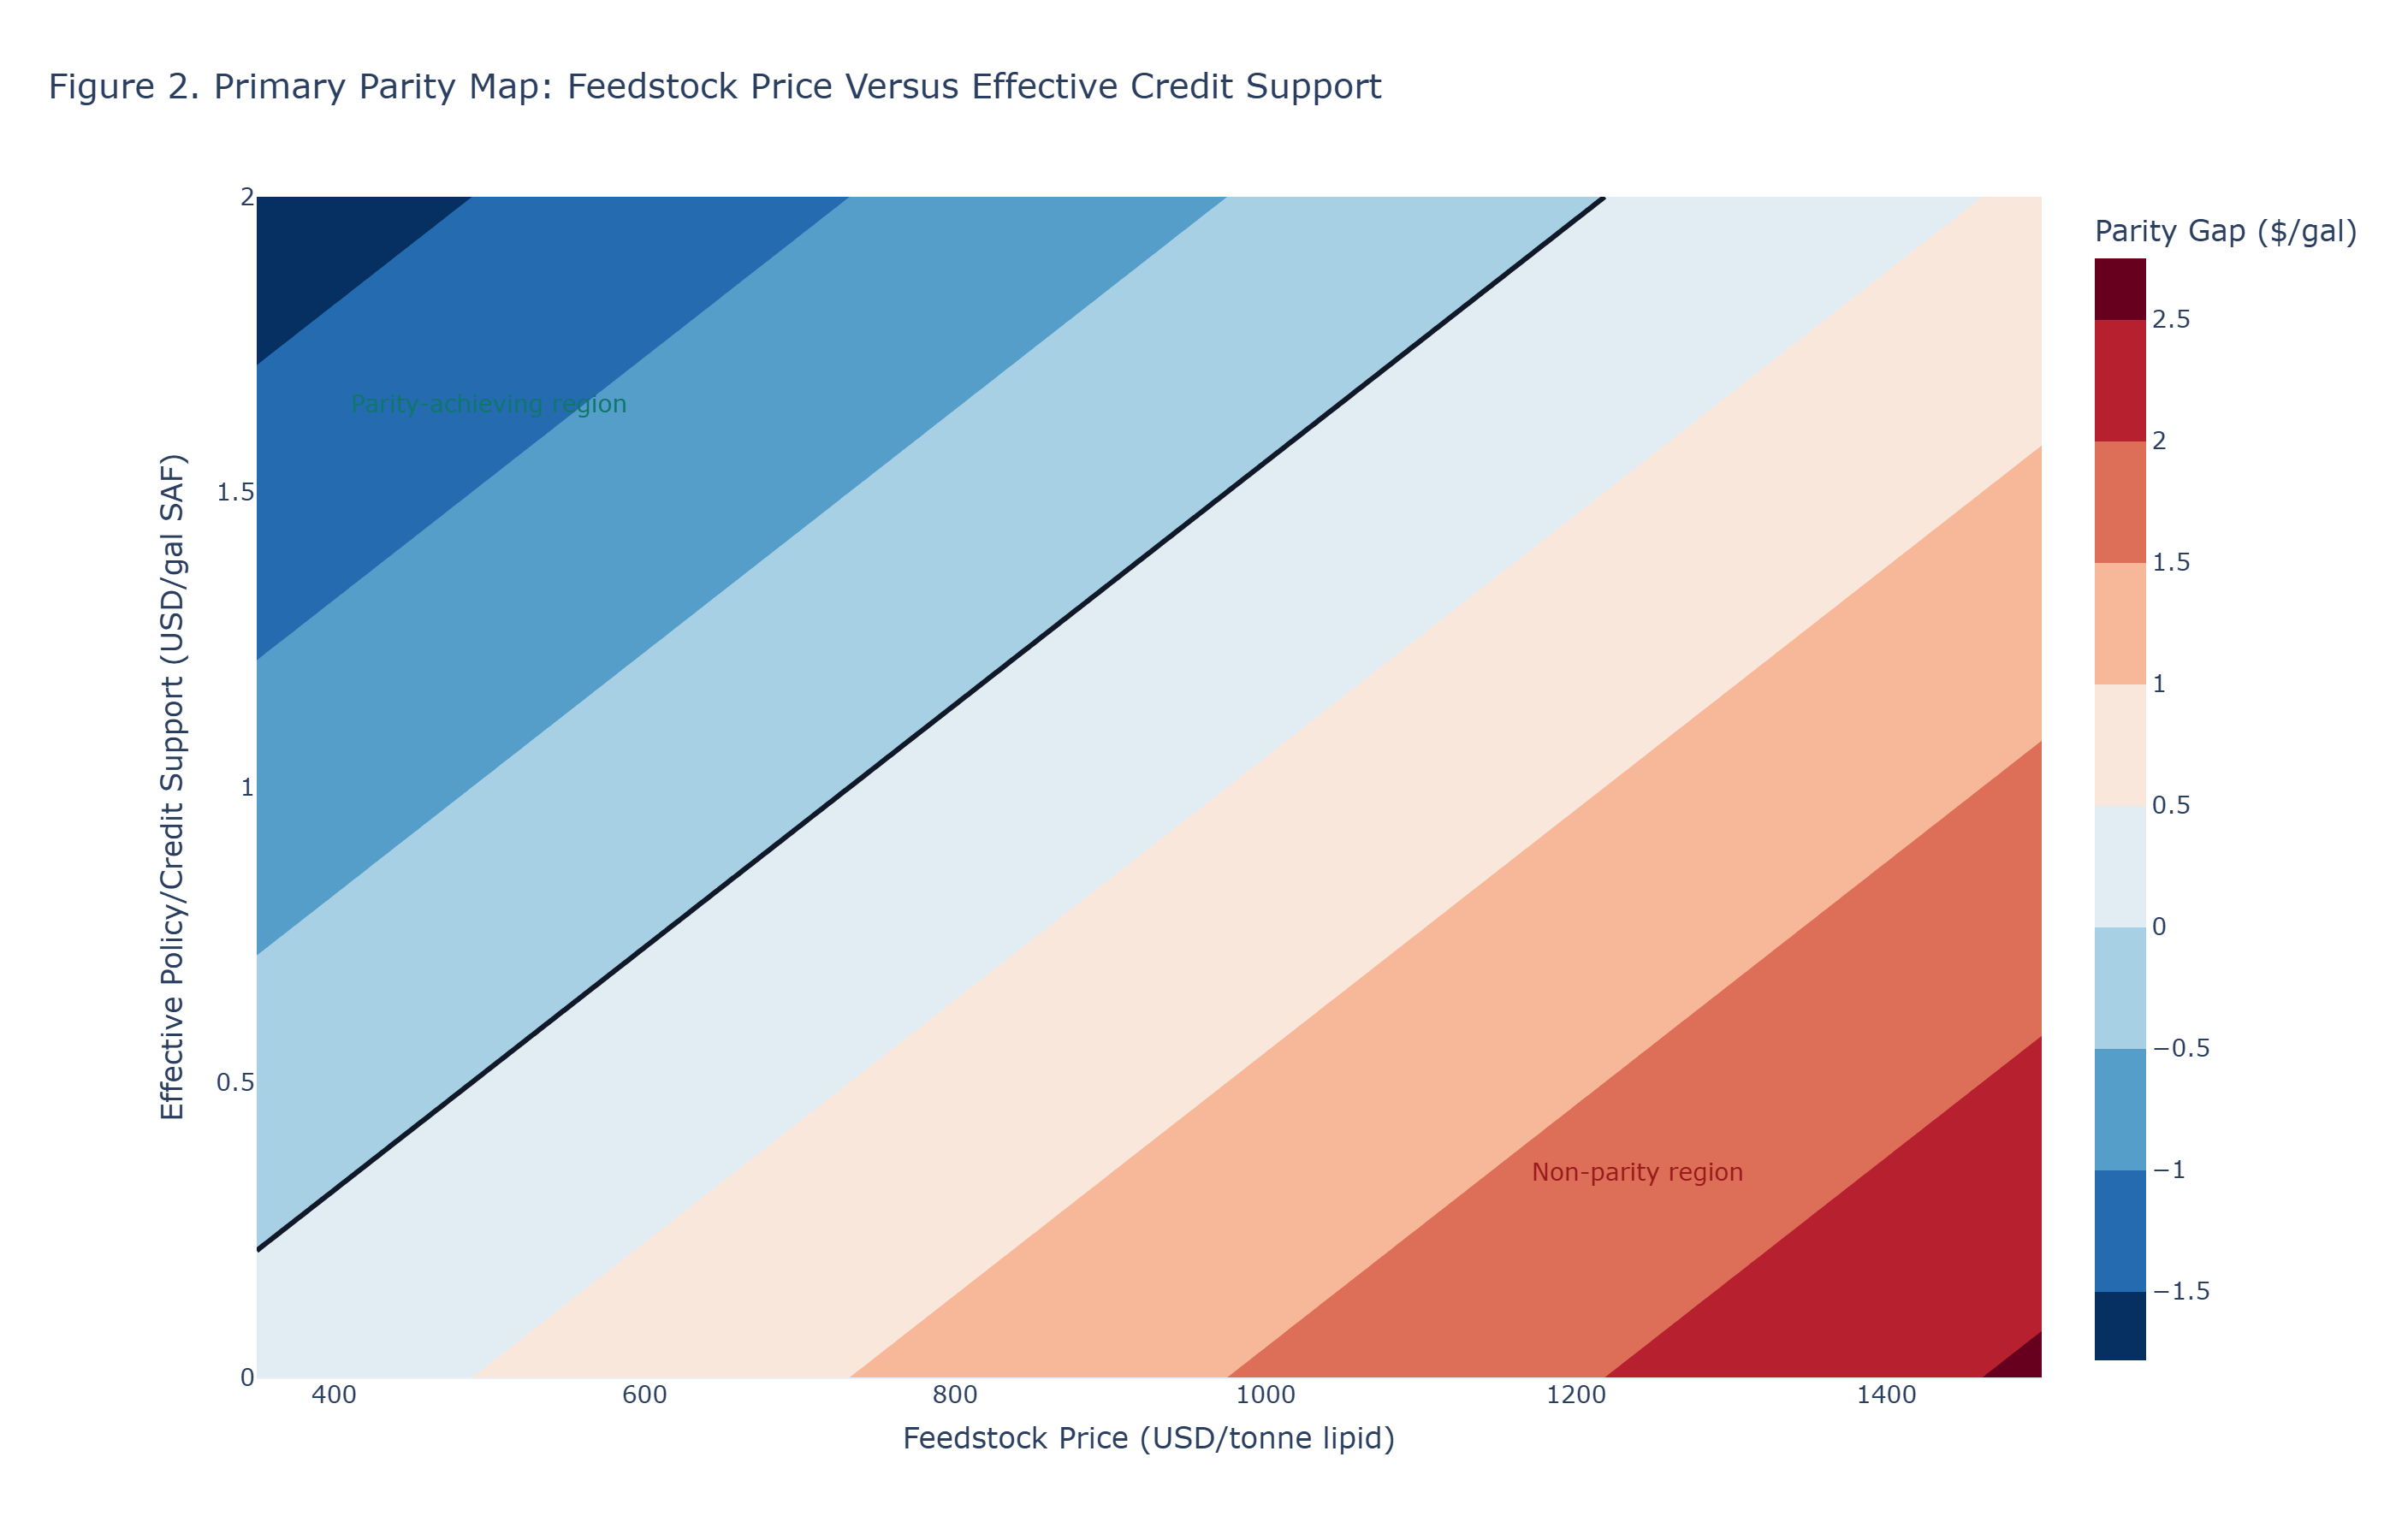
Decision statement
- The parity boundary defines a narrow viability region: at modeled base credit support, parity requires feedstock <= ~$931/tonne; above this collapse threshold, the viable region is invalid.
Figure 3 - MSP Response with Parity Threshold
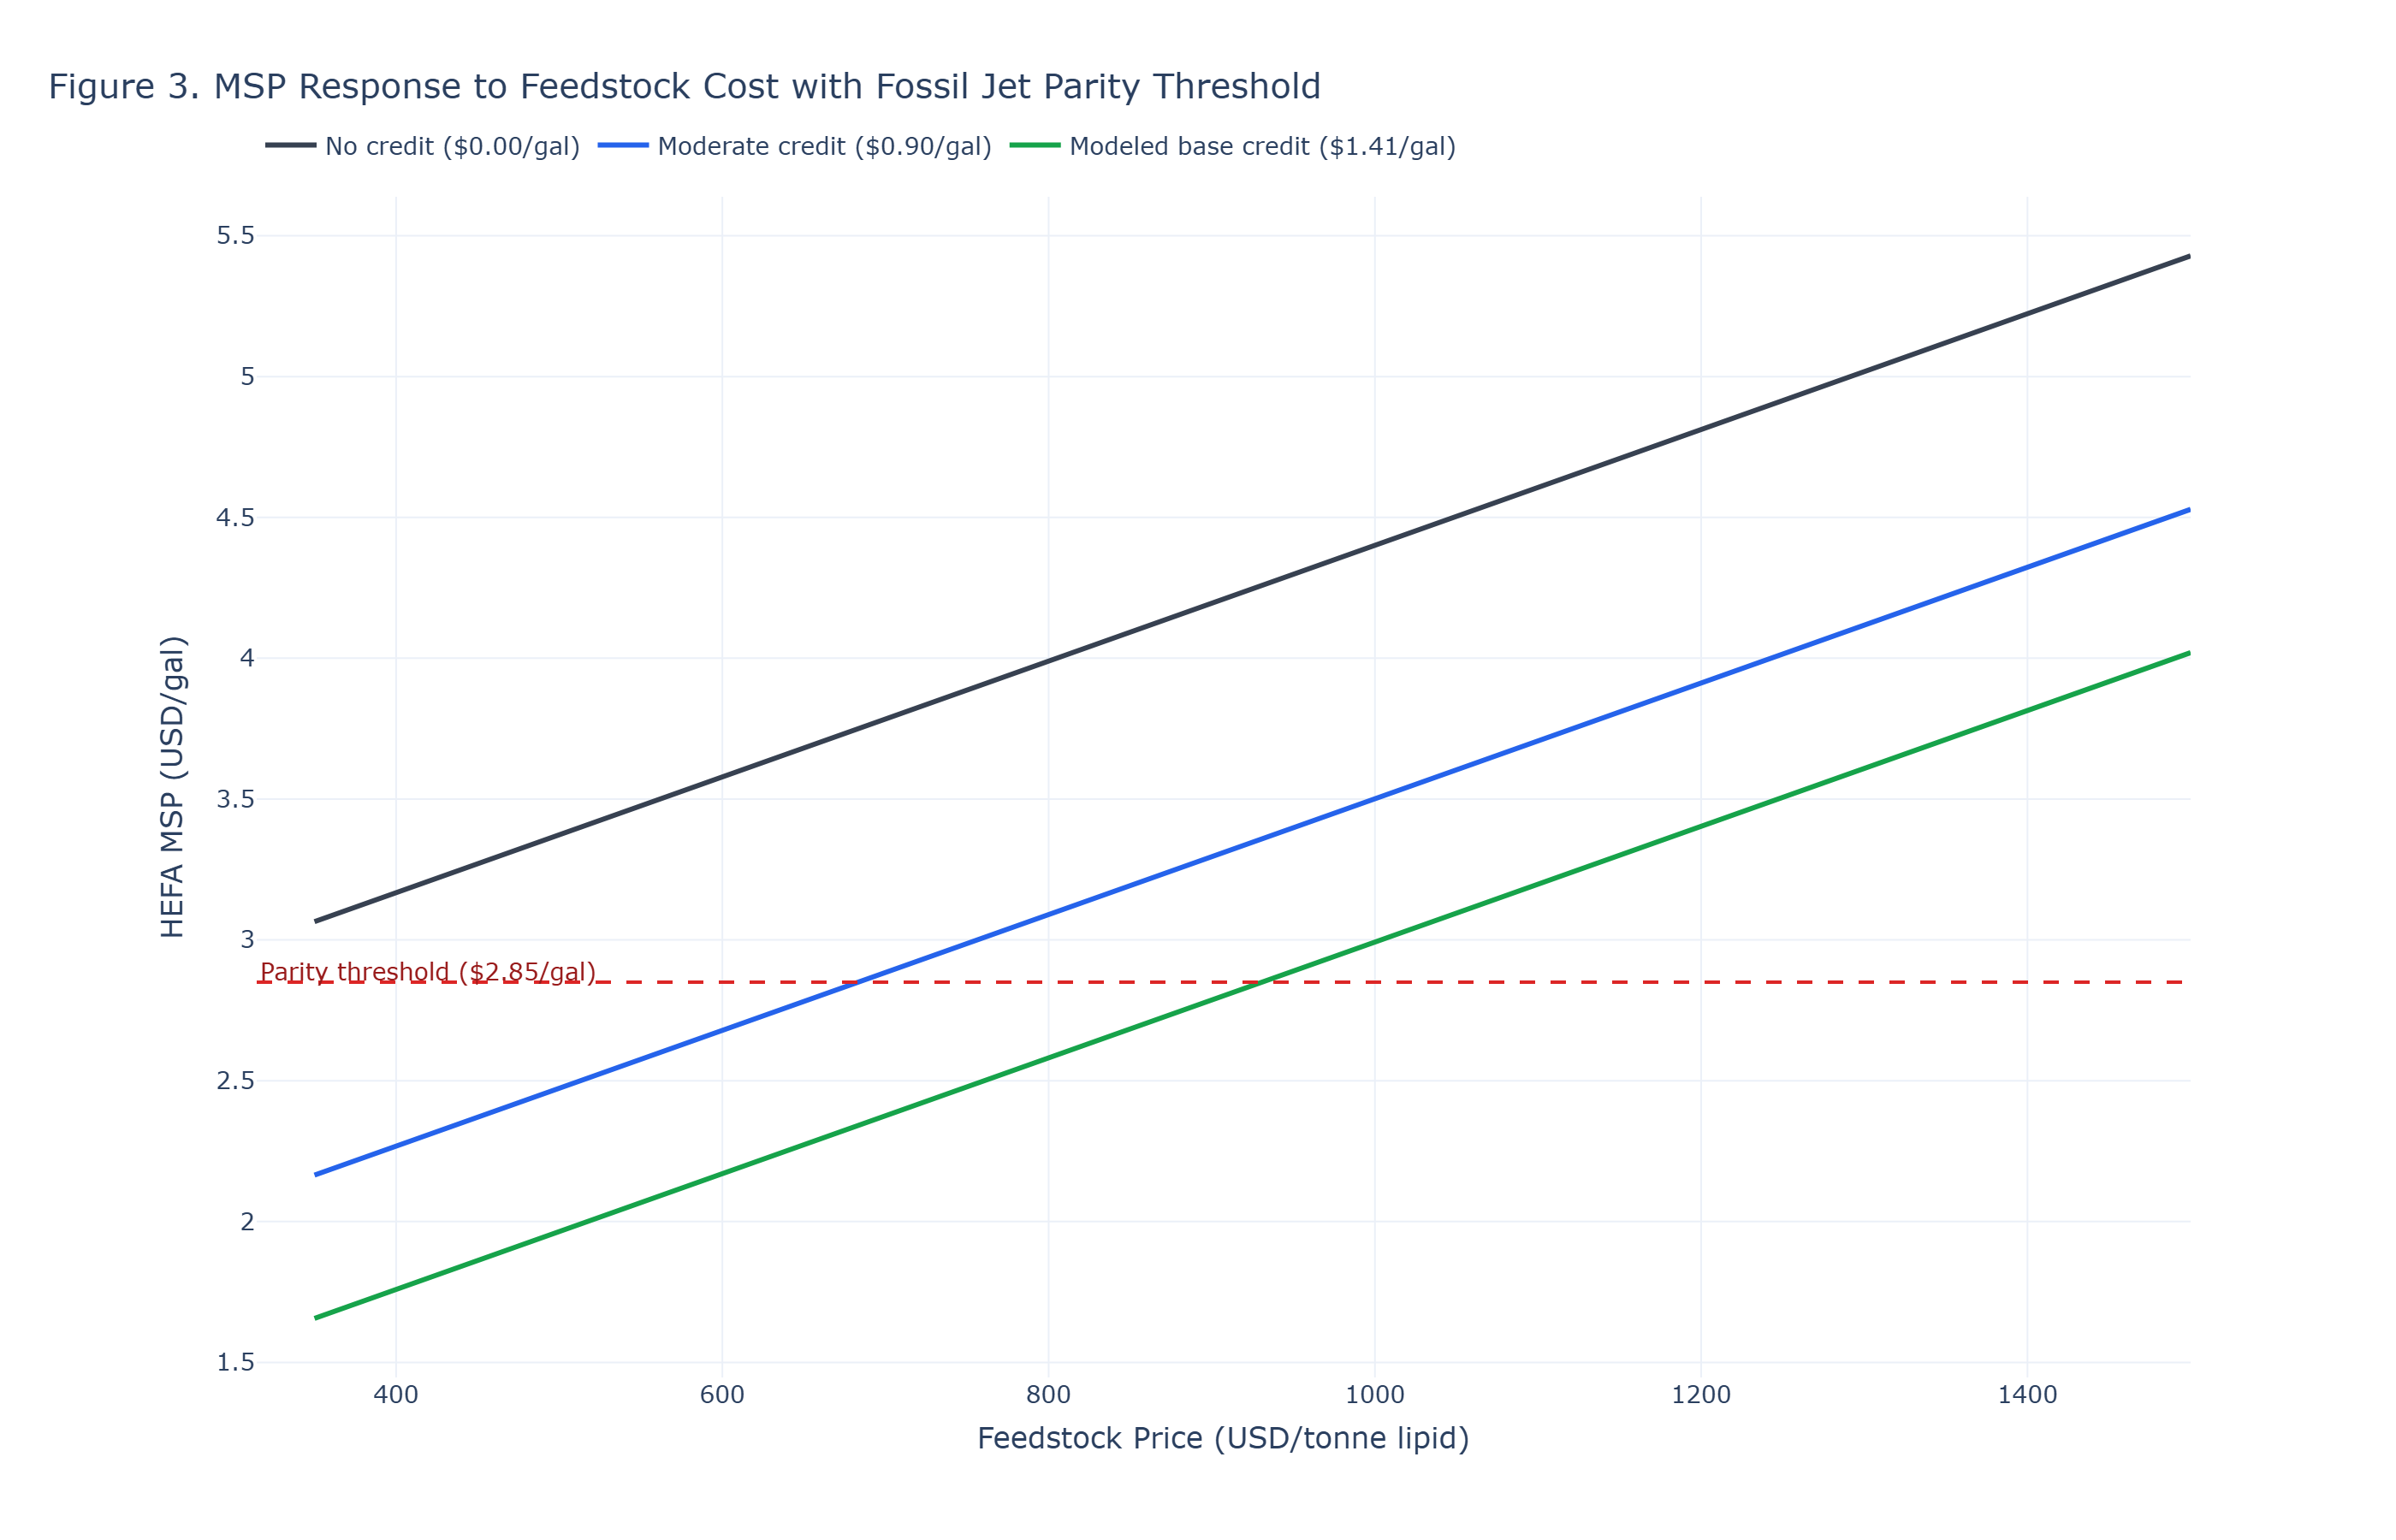
Decision statement
- In constrained-credit cases, parity ceilings are explicit: at moderate credit (~$0.90/gal), feedstock must remain <= ~$683/tonne; at no credit, parity is not achievable above ~$245/tonne.
Figure 4 - Fragility Penalty from Feedstock Escalation
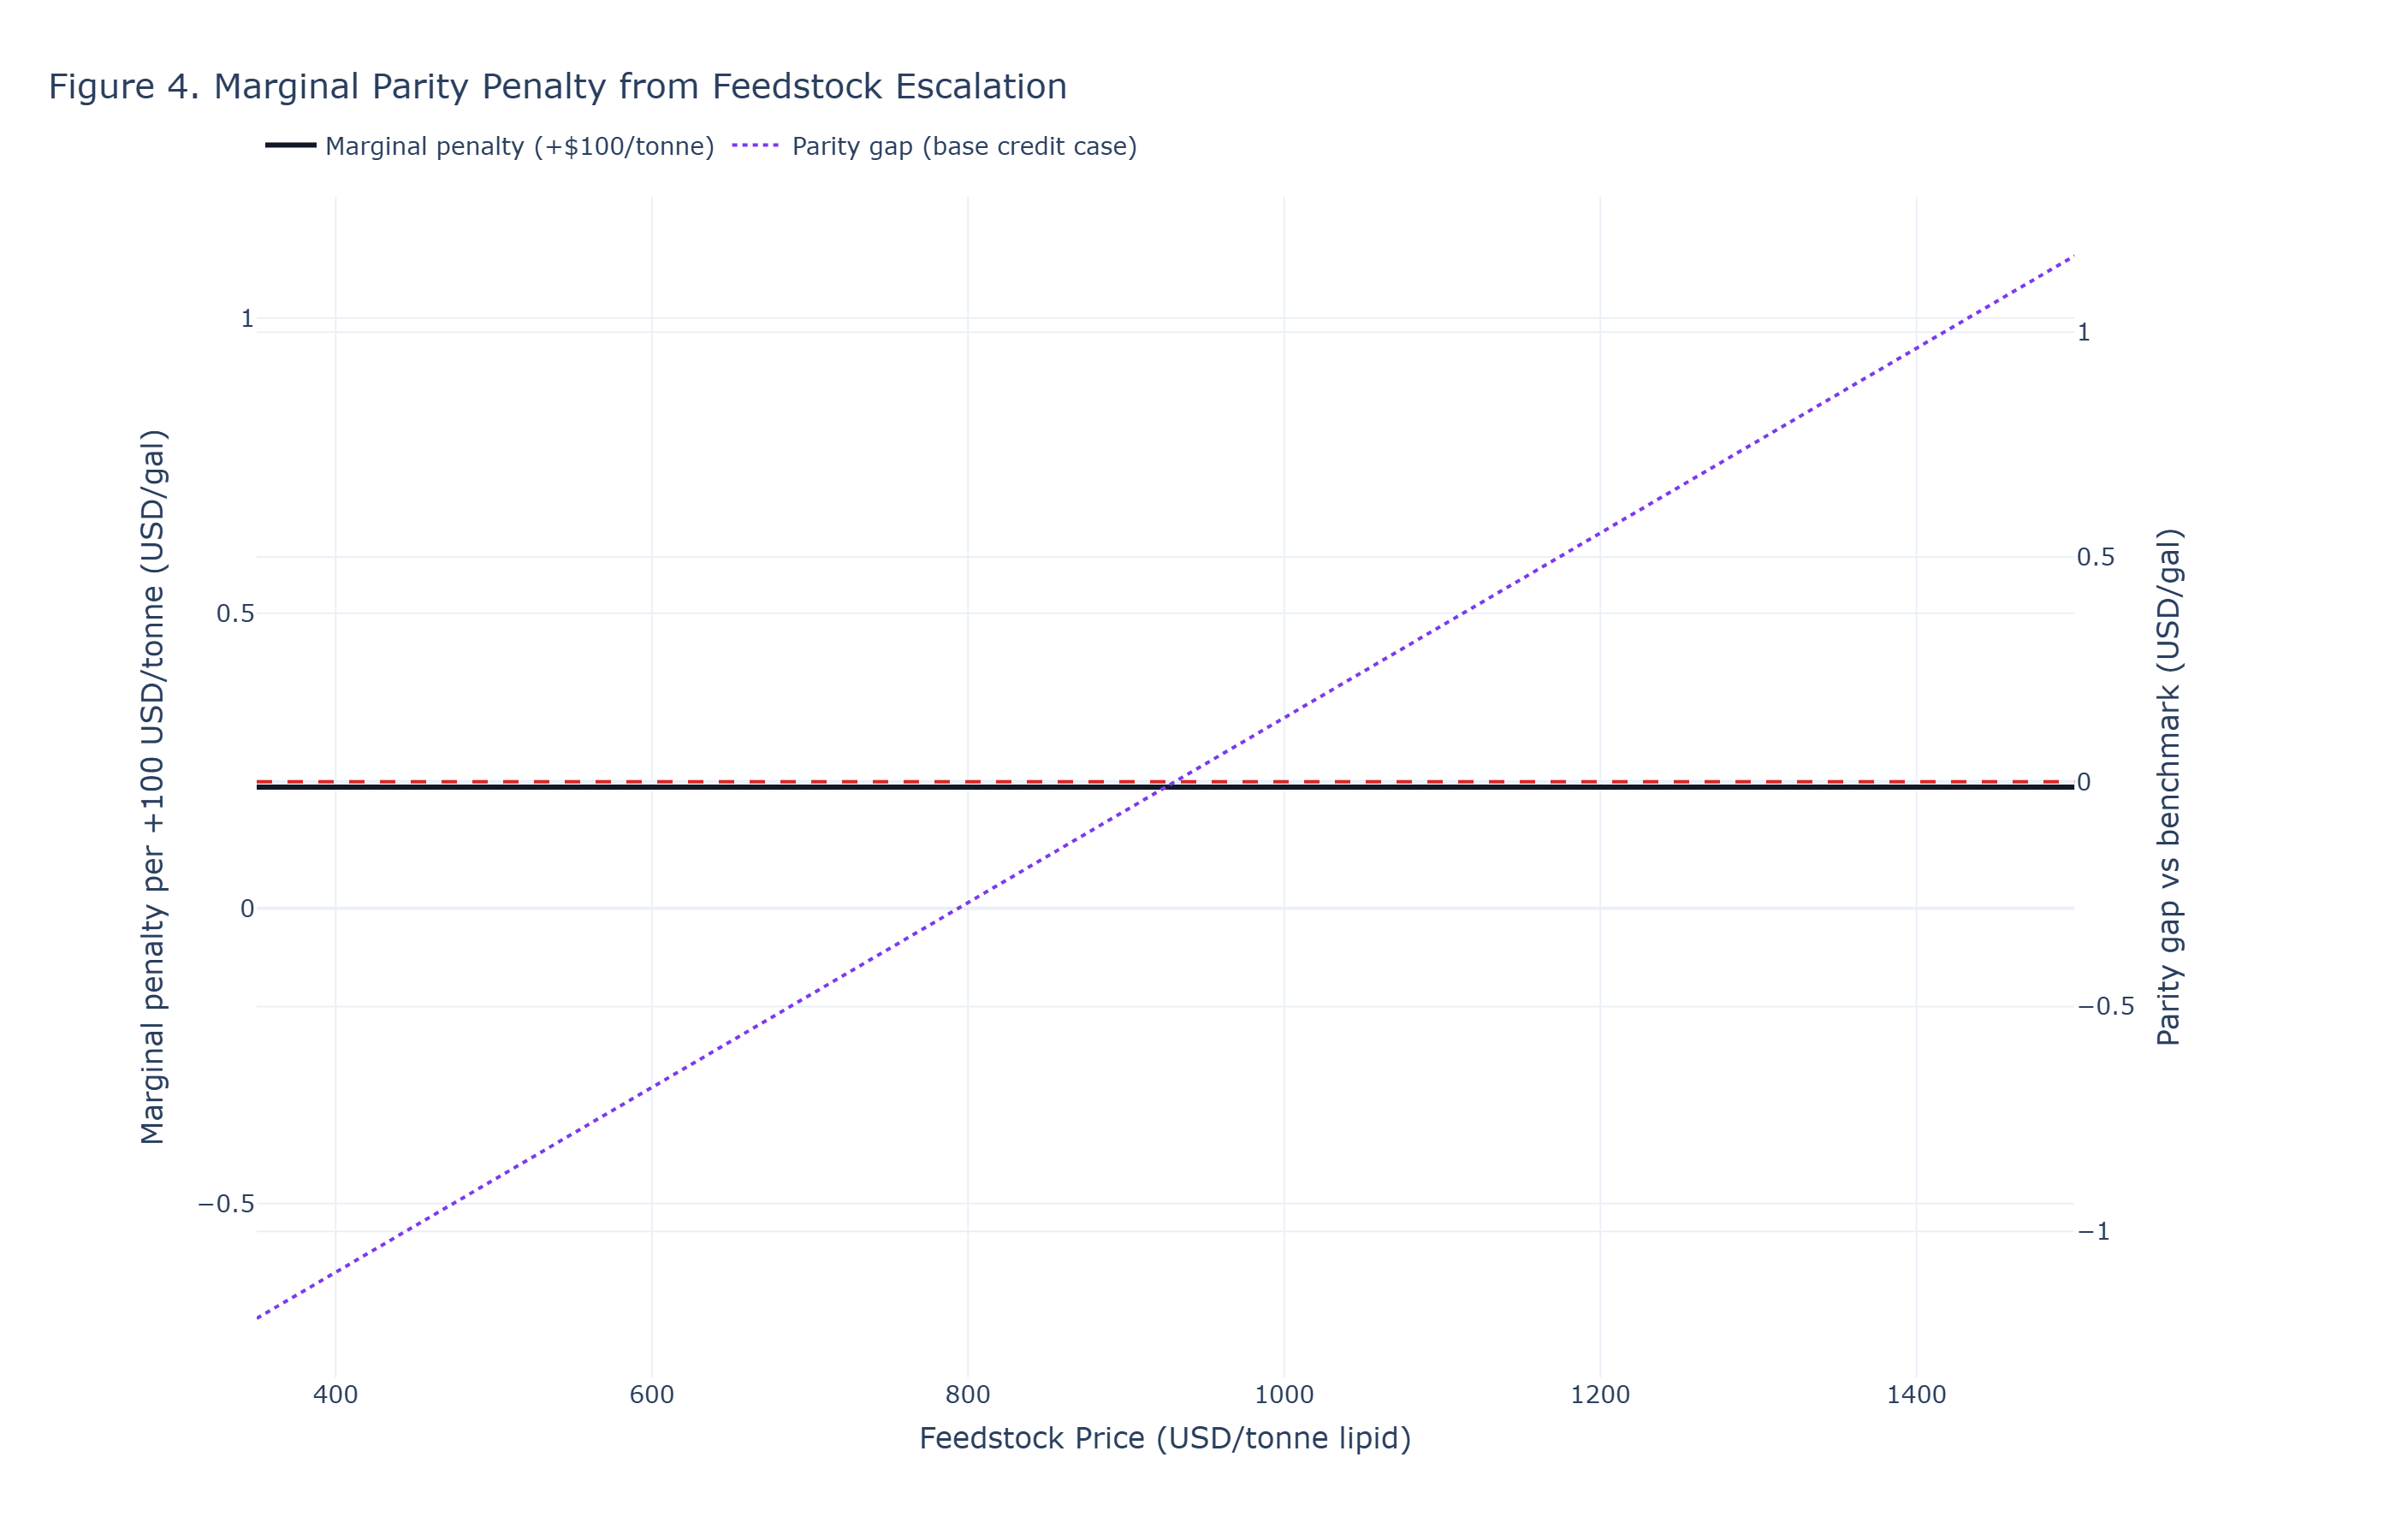
Decision statement
- d(MSP)/d(feedstock) ~= 0.00206 $/gal per $/tonne (equivalently +$0.206/gal per +$100/tonne), indicating persistent structural fragility.
Figure 5 - Decision Summary Figure
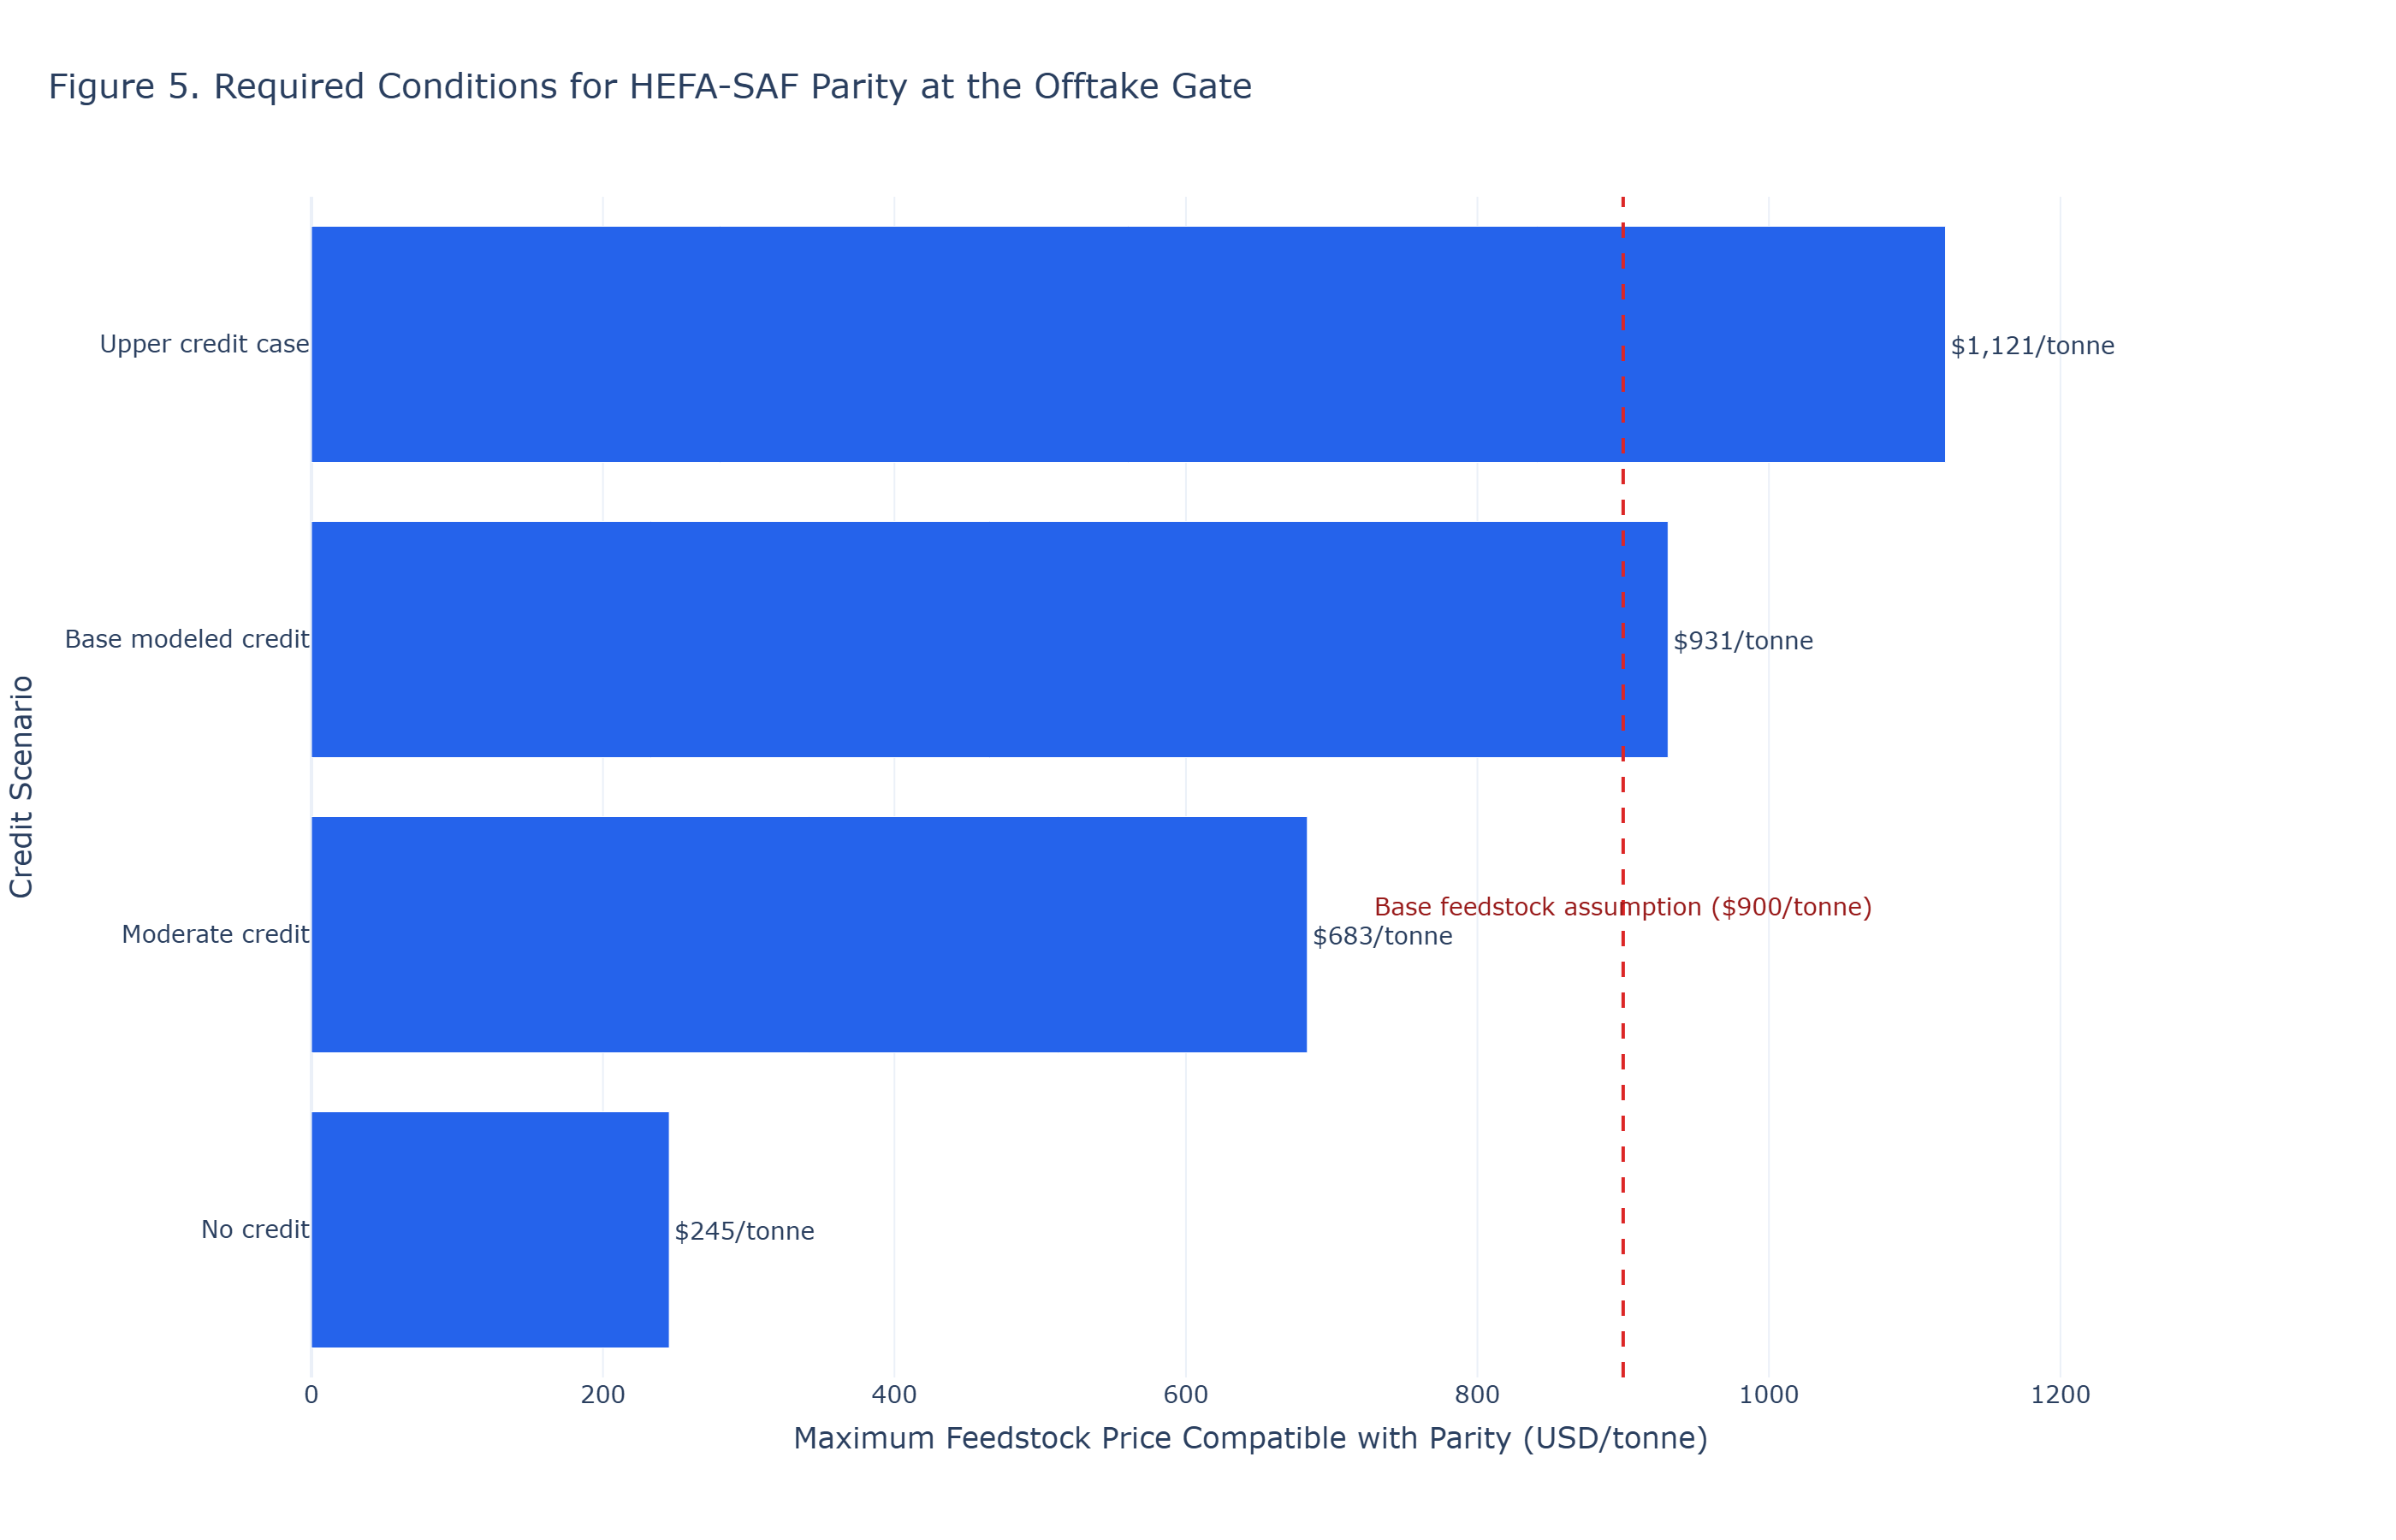
Decision statement
- Under moderate and low credit support, parity is either highly constrained or impossible at realistic feedstock prices.
- Base-case parity headroom is near-degenerate: only ~$31/tonne separates the base feedstock assumption from structural collapse.
Structural Claim
HEFA-SAF parity is structurally constrained: feedstock price and realized credit value are the governing variables, while CI and hydrogen costs act as secondary modifiers of regime accessibility. HEFA parity is structurally dependent on access to low-cost lipid feedstocks, a condition that does not scale with demand. Under modeled base credit, parity fails above ~$931/tonne feedstock, leaving only a narrow viable region. Once realistic feedstock pricing and policy uncertainty are introduced, the apparent parity region contracts significantly. Breaches of these boundaries are classified as the Feedstock-Policy Constraint Regime.
Constraint Statement (DG-PFF)
Under realistic lipid-price conditions, HEFA-SAF parity is not broadly achievable; parity persistence requires sustained low feedstock pricing and credit realization above collapse thresholds.
Product B: Technical Note (Audit Trail)
1. Decision Context
This note is the HEFA feasibility boundary layer (Product A: Parity). It identifies whether parity is structurally possible under benchmark-consistent steady-state assumptions before operational survivability stress is applied. Operational degradation variables (dispatch volatility, outage behavior, and runtime instability) are intentionally excluded from this note and should be evaluated in a companion fragility note. This analysis applies the DG-PFF (Parity and Fragility Framework) to evaluate whether HEFA-SAF achieves cost parity under real feedstock and policy conditions.
2. Analytical Lens (DG-PFF)
- Parity condition: MSP_HEFA <= fossil jet delivered benchmark.
- Fragility condition: parity persistence under lipid-price, credit-value, and CI perturbations.
- Decision principle: Parity alone is insufficient; viability requires persistence of parity under perturbation.
3. Parity Claim
The parity claim tested is that HEFA-SAF can undercut fossil jet at the offtake gate under current feedstock and credit conditions.
4. Parity Metric
Parity is defined at the boundary where MSP_HEFA equals the delivered fossil jet benchmark cost under stated CI and credit assumptions.
5. Fragility Metric
Fragility in this parity-layer note is reported as structural collapse thresholds, not operational degradation dynamics. Parity collapses when any of the following conditions are breached: feedstock > ~$931/tonne, CI > ~37.4 gCO2e/MJ, or effective credit < ~$1.35/gal. These collapse conditions explicitly invalidate the parity-defined viable region even when other assumptions remain favorable.
6. Parity-Fragility Relationship
Product A defines the structural parity region under steady-state assumptions; Product B must test that region under realistic operating and market constraints and explicitly invalidate portions that fail collapse criteria. In this note, the structural invalidation boundaries are feedstock > ~$931/tonne, CI > ~37.4 gCO2e/MJ, and effective credit < ~$1.35/gal.
7. Methods and Traceability
- Fossil jet benchmark basis: Fixed $2.85/gal reference benchmark used in the parity equation (
assets/data/notes/hefa-cost-parity-vs-fossil-jet/hefa_parity_inputs.json). This is a screening anchor, not a fuel-price forecast. - Fossil benchmark fragility check: Holding other variables constant, a +/-$0.50/gal jet benchmark shift moves the feedstock collapse threshold by approximately +/-243/tonne (from ~688/tonne at $2.35 jet to ~1,174/tonne at $3.35 jet).
- Feedstock benchmark basis: Base feedstock assumption $900/tonne with solved parity threshold of ~$930.8/tonne.
- Hydrogen basis and stress range: Process hydrogen cost is benchmark-derived from NREL HEFA OPEX ($32.5MM/yr over 50MM gal/yr = ~$0.65/gal). This is not a green-H2 delivered-price assumption. A +$0.25/gal hydrogen cost shock reduces the feedstock collapse threshold by ~122/tonne.
- CAPEX derivation: Annual output 50MM gal/yr, total CAPEX $410MM, discount rate 10%, life 25 years (CRF ~11.02%), yielding annualized CAPEX of ~$0.903/gal.
- Credit stack basis and CI proxy scope: Max credit modeled at $1.80/gal with CI-linked linear compression from 20 to 89 gCO2e/MJ; decision scenarios include no-credit, moderate-credit ($0.90/gal), modeled base credit (~$1.41/gal), and upper credit case. The CI-credit mapping is a screening proxy and not a scheme-specific implementation of CORSIA, RED III, or LCFS accounting.
- Credit policy durability scope: The modeled base credit case (~$1.41/gal) should be interpreted as a stacked-credit screening case; policy durability, stacking eligibility, and reform/sunset risk must be tested in transaction diligence.
- CI threshold interpretation anchor: The ~37.4 gCO2e/MJ collapse threshold is a model-internal proxy threshold derived from the linear CI-credit mapping above. In practical UCO-HEFA screens, feedstock and credit realization are expected to bind before CI, unless pathway CI materially degrades.
- Co-product treatment: SAF_HEFA benchmark data includes coproduct credits (-$21.0MM/yr, approximately -$0.42/gal). This parity-layer model excludes explicit coproduct credit in the structural boundary calculation to preserve a conservative screen; adding full coproduct credit would shift the feedstock collapse threshold upward by approximately +204/tonne.
- Scenario grid specification: Feedstock sweep $350-$1,500/tonne and effective credit sweep $0.00-$2.00/gal exported to
assets/data/notes/hefa-cost-parity-vs-fossil-jet/parity_surface_grid.csv. - Uncertainty method boundary: This note uses deterministic boundary sweeps for Product A screening. Stochastic persistence treatment belongs to Product B and should be read jointly for investment decisions.
- Standalone readability guardrail: Companion feedstock-risk distribution modeling uses a lognormal volatility setting with implied coefficient of variation of ~24%; deterministic collapse margins in Product A should be interpreted against that dispersion.
8. Publication Completion Checklist
- ✓ Figure 1 benchmark framing complete and annotated
- ✓ Figure 2 primary parity map complete with viability boundary language
- ✓ Figure 3 MSP response complete with parity-threshold crossings
- ✓ Figure 4 fragility-penalty metric complete with labeled slope
- ✓ Figure 5 decision summary complete with threshold windows by credit scenario
- ✓ Structural claim tied to viability-region collapse
- ✓ Decision summary updated with final thresholds and confidence tag
- ✓ Explicit parity-fragility relationship statement included (Section 6)
- ✓ Feedstock fragility slope disclosed as a decision output
This analysis applies the Decision-Grade Parity–Fragility Framework (DG-PFF), developed by Insight Quantix. This note identifies both parity conditions and the fragility thresholds under which those conditions fail. This analysis extends DG-PFF beyond hydrogen systems, demonstrating applicability to SAF pathways under feedstock-driven cost uncertainty.
Learn more -> Companion fragility-first note ->
Citation Readiness & Reproducibility
- Publication date & version: March 2026 | v1.3
- Canonical URL: https://insightquantix.com/insights/hefa-cost-parity-vs-fossil-jet/
- Inputs and thresholds: See model equations, threshold tables, and linked artifacts under
assets/data/notes/hefa-cost-parity-vs-fossil-jet/. - Reproducibility note: Parity boundaries are most sensitive to feedstock price, effective credit realization, and CI-linked credit compression assumptions.
- Disclosure: Insight Quantix derived all analytical conclusions independently; external references provide context only.
How to Cite This Analytical Note
APA Format
Gomez, J. R. (2026). HEFA-SAF Cost Parity vs Fossil Jet: Viability Region Under Feedstock and Credit Constraints (Insight Quantix Analytical Note IQ-AN-SAF-2026-01, v1.3). Retrieved from https://insightquantix.com/insights/hefa-cost-parity-vs-fossil-jet/
Chicago Format
Gomez, Jamie R. "HEFA-SAF Cost Parity vs Fossil Jet: Viability Region Under Feedstock and Credit Constraints." Insight Quantix Analytical Note IQ-AN-SAF-2026-01, v1.3, March 2026. https://insightquantix.com/insights/hefa-cost-parity-vs-fossil-jet/.
BibTeX
@techreport{Gomez2026_SAF_Parity,
  author = {Gomez, Jamie R.},
  title = {HEFA-SAF Cost Parity vs Fossil Jet: Viability Region Under Feedstock and Credit Constraints},
  institution = {Insight Quantix},
  year = {2026},
  type = {Analytical Note},
  number = {IQ-AN-SAF-2026-01},
  month = mar,
  url = {https://insightquantix.com/insights/hefa-cost-parity-vs-fossil-jet/}
}Appendix A: Modeling Parameters
- Model form: See the governing equations and threshold definitions in the technical section of this note.
- Primary data artifacts:
assets/data/notes/hefa-cost-parity-vs-fossil-jet/ - Primary figure artifacts:
assets/img/notes/hefa-cost-parity-vs-fossil-jet/ - Reproducibility scope: This appendix anchors file locations and parameter traceability for decision-grade review.
About the Author
About Insight Quantix
Insight Quantix publishes independent analytical work for transparency and decision clarity. The analysis examines benchmark-anchored, audit-defensible economic risk conditions relevant to capital allocation decisions in the $10M-$500M range.
Validation Methodology: ASTM E3200 | ISO 14040/14044 | NREL benchmark-anchored Engine Documentation: Available upon request Website: insightquantix.com
This analytical note is provided for informational and educational purposes only and does not constitute investment advice, financial advice, engineering design recommendations, or legal interpretation of tax policy. Readers should conduct independent due diligence and consult qualified professionals before making capital allocation decisions. The analysis reflects representative scenarios based on stated modeling parameters and should not be construed as a guarantee of project performance or economic outcomes. Specific project economics require site-specific analysis accounting for local conditions, technology configurations, and regulatory environments. Insight Quantix makes no warranties, express or implied, regarding the accuracy, completeness, or reliability of this information for any particular purpose.
© 2026 Insight Quantix. This analytical note may be cited with proper attribution.