Intermittent power cannot economically support continuous industrial systems below a critical utilization threshold.
Temporal mismatch converts low-cost energy into underutilized capital.
Most techno-economic results are conditionally true and operationally unattainable without constraint validation.
Projects that trigger these conditions do not pass decision-grade screening.
Scope clarification: Hydrogen, ammonia, and SAF are used here as empirical evidence streams that establish the constraint pattern; they are not the subject of this note.
Prior analyses of hydrogen, sustainable aviation fuel, and ammonia reveal a consistent failure pattern: systems that rely on intermittent power lose economic viability despite favorable input costs.
This note formalizes the failure regimes observed in prior fuel-specific analyses into a governing constraint.
The limitation is not fuel-specific. It is structural.
Governing Claim
The structural utilization boundary is approximately 65% effective utilization, below which no decision-grade configuration preserves economic viability.
Decision Strip (Topline Gate)
- No-Go:
CF_eff < ~65% - Decision handling: Entry into Temporal Decoupling Failure Regime.
- Economic recovery: Not achievable below the structural utilization boundary.
- Supporting context: confidence high (source-validated thresholds and stress classifications); primary failure driver is utilization collapse under temporal mismatch. Entry into this regime is not a degradation in performance. It is a loss of economic recoverability.
Decision Summary (Threshold Output)
- PROCEED:
CF_eff >= ~85%, delivered electricity<= ~$45/MWh, temporal penalty<= ~$20/unit, and support exposure not required for base viability. - CAUTION:
CF_effremains above model-implied minimum and temporal penalty remains below collapse tier; parity holds with narrow threshold distance. - REWORK: project depends on high support realization, high storage burden, or elevated firming cost to preserve parity.
- No-Go:
CF_eff < ~65%-> entry into Temporal Decoupling Failure Regime. - Reinforcing collapse indicators: temporal penalty
> ~$50/unitor parity dependence on fragile support realization.
Industrial viability is governed by temporal alignment between variable power supply and continuous process demand. As utilization declines, the viable operating region collapses rapidly from a broad cost space into a narrow band of high-utilization, partially firmed operating conditions. Storage scaling and underutilization penalties compound faster than nominal power savings. This defines the Temporal Decoupling Failure Regime.
Feasibility Boundary
| Boundary | Canonical threshold | Mechanism | Decision implication |
|---|---|---|---|
Utilization floor (CF_eff) | < ~65% effective utilization | Entry into Temporal Decoupling Failure Regime; fixed-cost dilution and temporal penalties dominate | No-Go |
| Delivered electricity ceiling | > ~$55/MWh at high-utilization operating targets | Variable-cost dominance removes parity headroom | Rework or No-Go unless structure changes |
| Storage continuity floor | < ~12h buffer when CF_eff < ~0.60 with continuous demand | Buffer insufficiency increases curtailment and cycling penalties | Rework |
| Policy robustness floor | Parity survives only under full-credit realization | Fragile support dependence collapses under degradation scenarios | Caution/Rework; No-Go if partial-loss cases fail |
Evidence basis (cross-domain, not subject scope)
- Hydrogen evidence: 45V Hydrogen Cost Parity and 45V Utilization Risk.
- Ammonia evidence: Clean Ammonia Cost Parity and Clean Ammonia Fragility.
- SAF evidence: HEFA-SAF Cost Parity and HEFA Feedstock Risk.
- Interpretation rule: these domains provide evidence of recurring failure mechanics; this note defines the decision standard that generalizes across them.
Decision Brief (3-Minute Screen)
Kill Conditions (Immediate No-Go)
The following conditions fail this screen and should be treated as immediate No-Go unless structure is redesigned:
Utilization below structural floor. If effective utilization falls below the model floor, fixed-cost dilution and temporal penalties invalidate parity.
Penalty-stack escalation. If temporal penalties rise above screening collapse ranges, modeled parity no longer survives persistence checks.
Policy-cliff dependence. If parity holds only under full-credit realization and fails under partial-loss scenarios, the investment case is non-robust.
Structured decision output
| Classification | Trigger condition | Decision handling |
|---|---|---|
| Proceed | utilization, power-cost, and temporal-penalty thresholds all hold with non-fragile policy dependence | Continue to project diligence and contracting validation. |
| Caution | parity holds in base case but threshold distance is narrow | Proceed only with explicit downside underwriting. |
| Rework | viability depends on storage oversizing, policy concentration, or near-boundary assumptions | Redesign procurement, storage, or process integration before capital commitment. |
| No-Go | project enters Temporal Decoupling Failure Regime | Stop advancement to FID until architecture changes. |
DG-PFF Execution Trace
- Parity condition defined against delivered benchmark under explicit utilization basis.
- Viability region mapped across utilization, delivered power, and temporal-penalty dimensions.
- Fragility quantified through threshold-distance and stress-case flips.
- Collapse boundaries identified under policy degradation and mismatch escalation.
- Explicit classification output produced: Proceed / Caution / Rework / No-Go.
Industrial Energy Constraint Triangle (No-Free-Lunch Condition)
- Vertices: Cost, Utilization, Storage, Continuity.
- Low-cost intermittent energy typically lowers utilization and raises mismatch exposure.
- High utilization generally requires firmer procurement that increases delivered power cost.
- Minimal storage lowers upfront buffer cost but increases curtailment and continuity losses.
No system can simultaneously optimize all four vertices of the Industrial Energy Constraint Triangle. There is no operating regime where low-cost electricity, high utilization, minimal storage, and continuous industrial demand are simultaneously achievable. This defines the Industrial Energy Constraint Triangle. There is no feasible configuration of electricity price, storage scaling, or capacity oversizing that restores both utilization and cost competitiveness once below the structural utilization floor. Violating this constraint does not degrade performance. It collapses viability.
Temporal Decoupling Failure Regime (Named Failure Mode)
Temporal Decoupling Failure Regime: the project fails when utilization requirements rise faster than physically realizable continuity under intermittent supply and realistic policy support.
Capital lock-in risk
- Upstream variable-power assets flex with resource shape.
- Downstream continuous industrial assets are capital-rigid and utilization-sensitive.
- Temporal mismatch transfers upstream flexibility into downstream fixed-cost dilution.
Below the structural utilization boundary, this is the dominant economic failure mode.
Confidence / robustness tag
Confidence: High (threshold values calibrated with source-validated evidence and classification structure validated).
Structural claim
Industrial-scale parity under intermittent power is not a single-price outcome. It is a synchronization-constrained boundary problem dominated by utilization preservation and temporal-penalty management. This establishes a utilization-bound law governing the economic coupling of intermittent energy systems to continuous industrial processes.
Constraint statement (DG-PFF)
Analyses that do not apply structured stress testing, threshold evaluation, and explicit classification cannot be considered decision-grade under DG-PFF.
Technical Note (Model Form)
Model form
Net_Unit_Cost
  ~= C_var
   + C_fixed * (CF_ref / CF_eff)
   + Temporal_Penalty_total
   - Realized_Policy_Credit

Parity when:
Net_Unit_Cost <= Delivered_Benchmark
Governing relationship (single-form view)
Effective_Cost ~= Base_Cost * (CF_ref / CF_eff) + Temporal_Penalty_total - Realized_Policy_CreditUtilization threshold form
CF_eff_min = K / (Delivered_Benchmark + Realized_Policy_Credit - C_var - Temporal_Penalty_total)Krepresents utilization-sensitive fixed-cost burden at the chosen reference basis.- If
CF_eff_min > 100%, no feasible operating strategy preserves parity under stated assumptions.
Evidence package roles (argument map)
| File | What it must prove |
|---|---|
utilization_ceiling_inputs.json | assumptions are explicit, auditable, and reproducible |
utilization_ceiling_scenarios.csv | failure persists across plausible operating regimes |
utilization_ceiling_thresholds.csv | hard boundary conditions exist and are classifiable |
temporal_penalty_decomposition.csv | failure is structural and mechanism-driven, not a single-parameter artifact |
Thresholds centerpiece (utilization_ceiling_thresholds.csv)
- Defines where viability ends in explicit
Proceed / Caution / Rework / No-Goboundary terms. - Quantifies transition sharpness (gradual drift vs cliff behavior) around the utilization floor.
- Anchors the collapse moment where cases cross into Temporal Decoupling Failure Regime.
Temporal Penalty Stack (Explicit)
Temporal_Penalty_total
  ~= P_storage_capex
   + P_storage_losses
   + P_curtailment_or_replacement
   + P_turndown_inefficiency
   + P_restart_and_cycling
+ P_interaction(CF_eff, storage_buffer, cycling_frequency)- Storage CAPEX
- Storage losses
- Curtailment
- Turndown inefficiency
- Cycling penalties
- Interaction term across utilization decline, storage strain, and cycling frequency
Cross-note disclosure: P_interaction(...) is an extension used in this cross-domain generalization layer; domain-specific ammonia decompositions remain additive in their published template form.
Temporal penalties are not additive adjustments; they compound and scale with utilization decline, forming the dominant cost driver below the utilization threshold.
Figure 1 - Utilization Ceiling Map
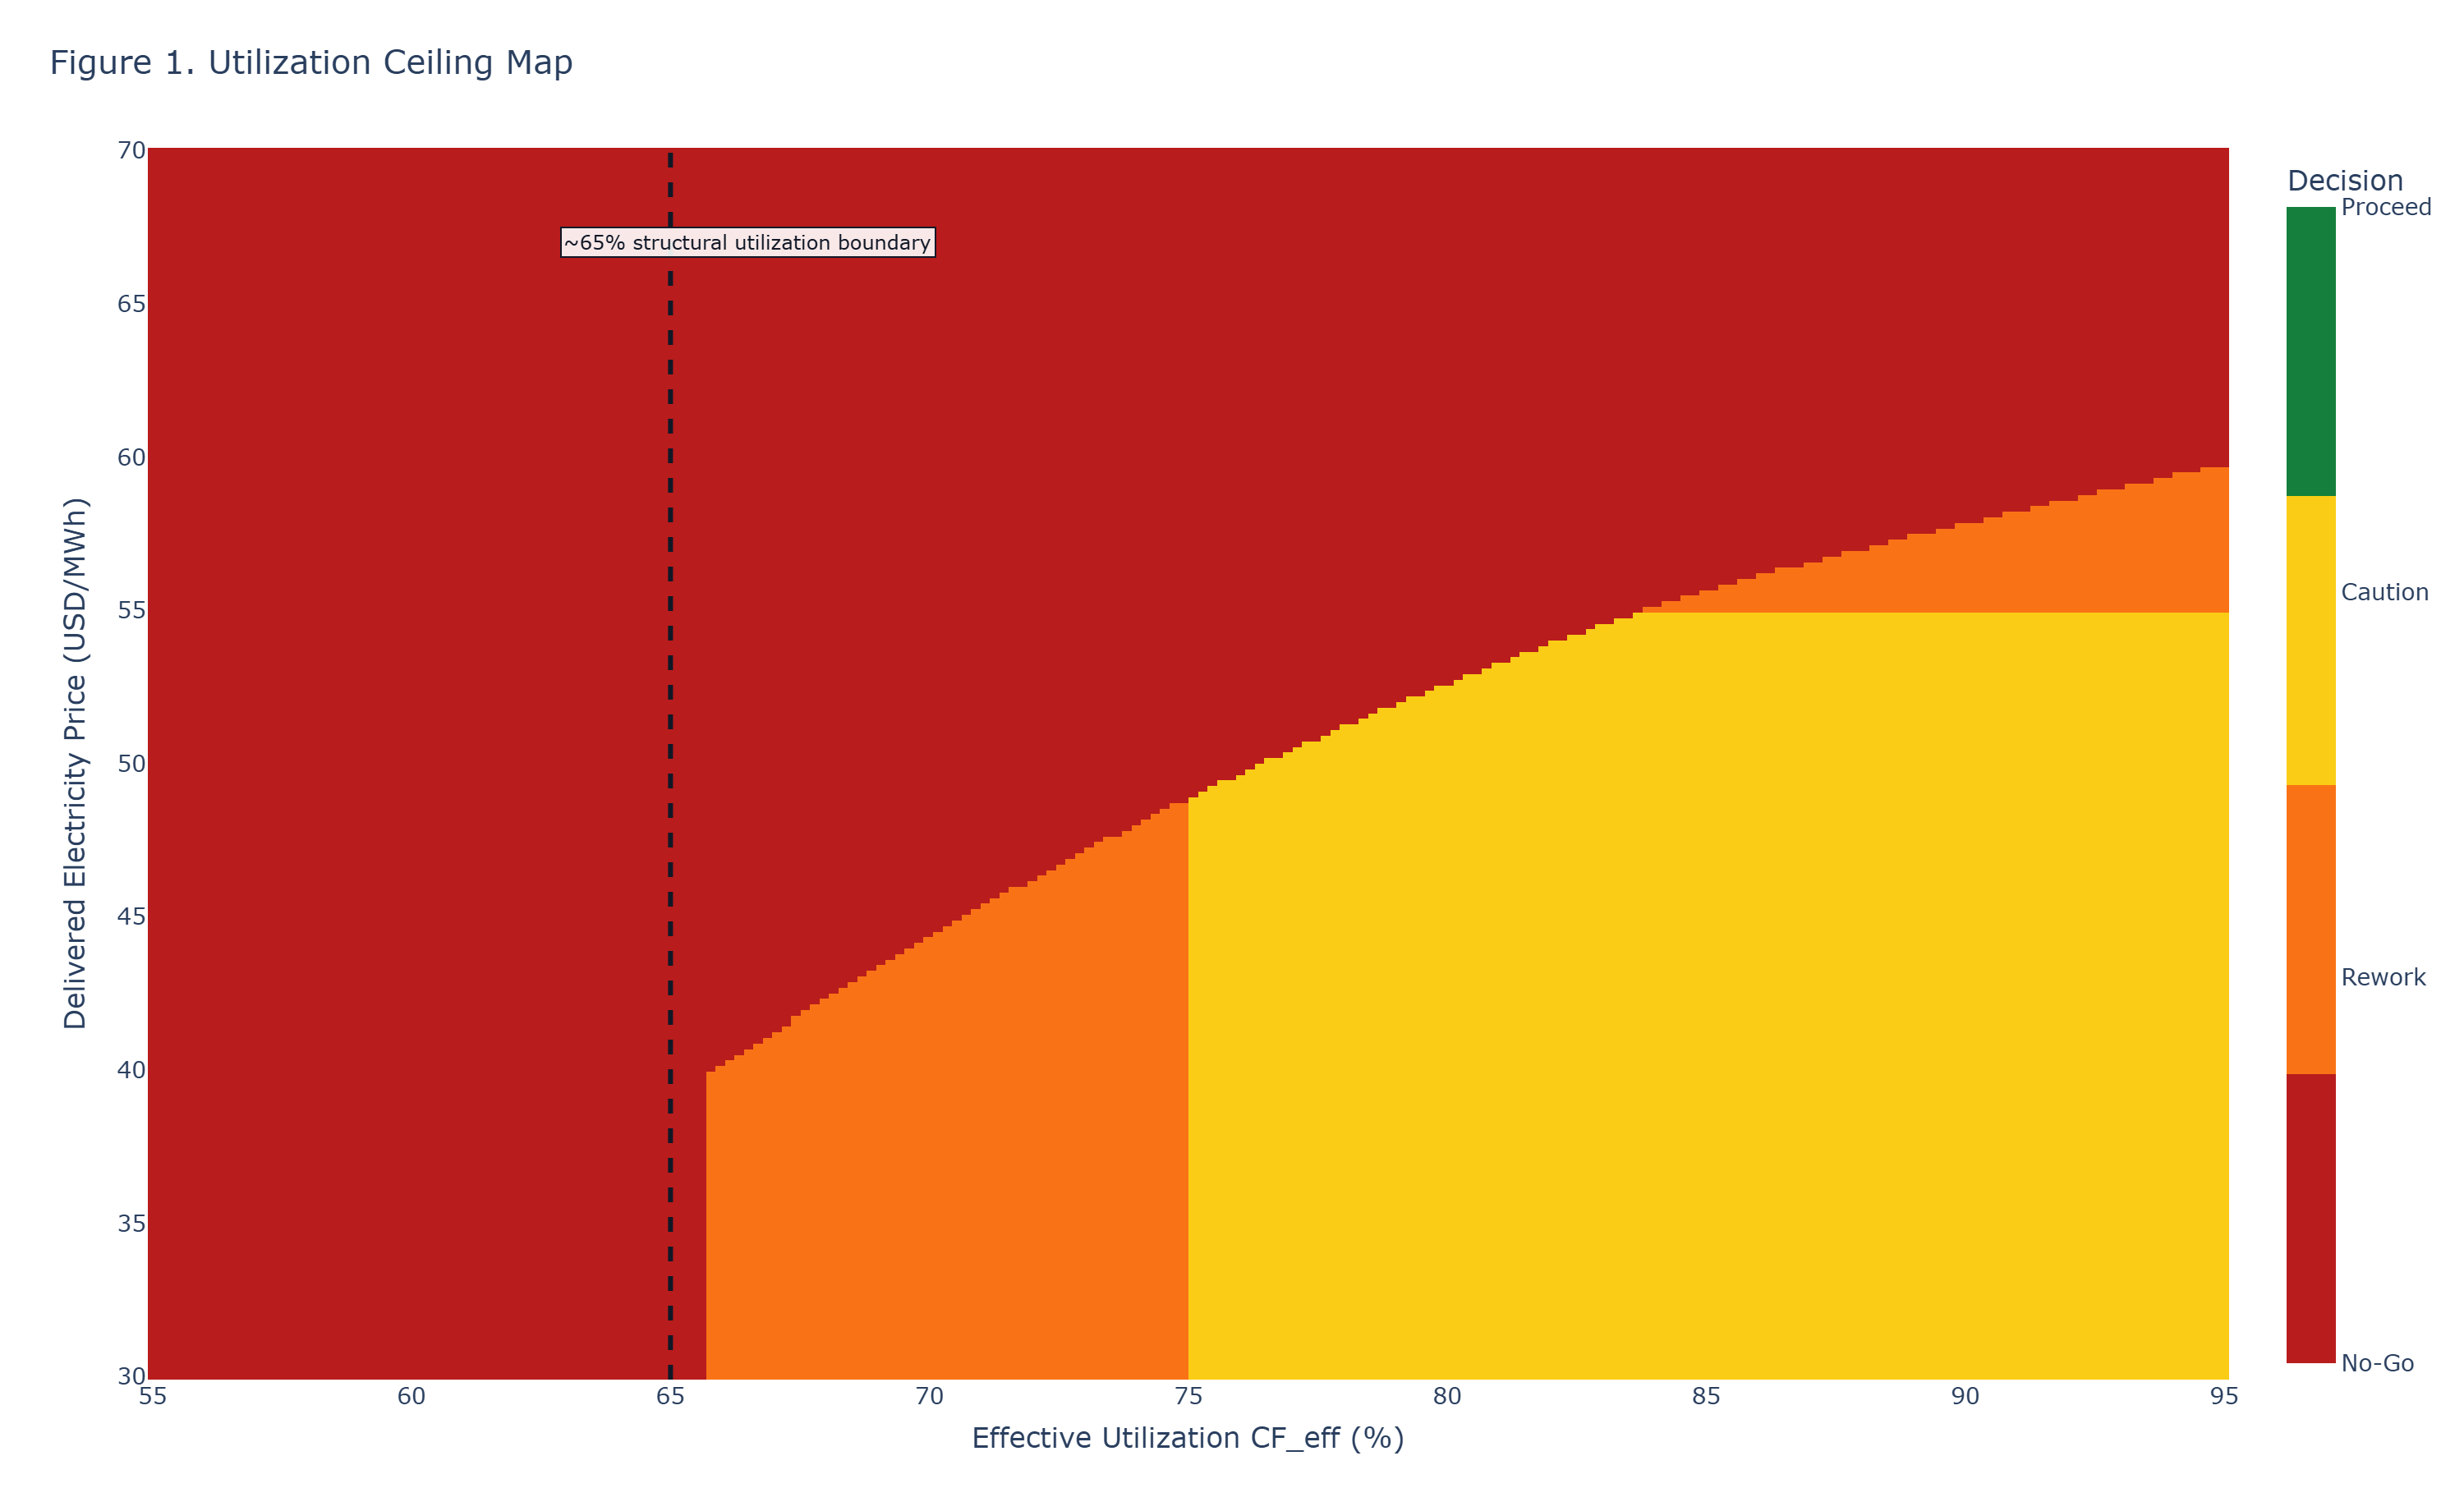
Decision statement
- Viability contracts rapidly once utilization drifts below structural floors, even under favorable nominal power prices.
- The viable operating region collapses from a broad cost space into a narrow band of high-utilization, partially firmed conditions.
Figure 2 - Constraint Triangle Regimes
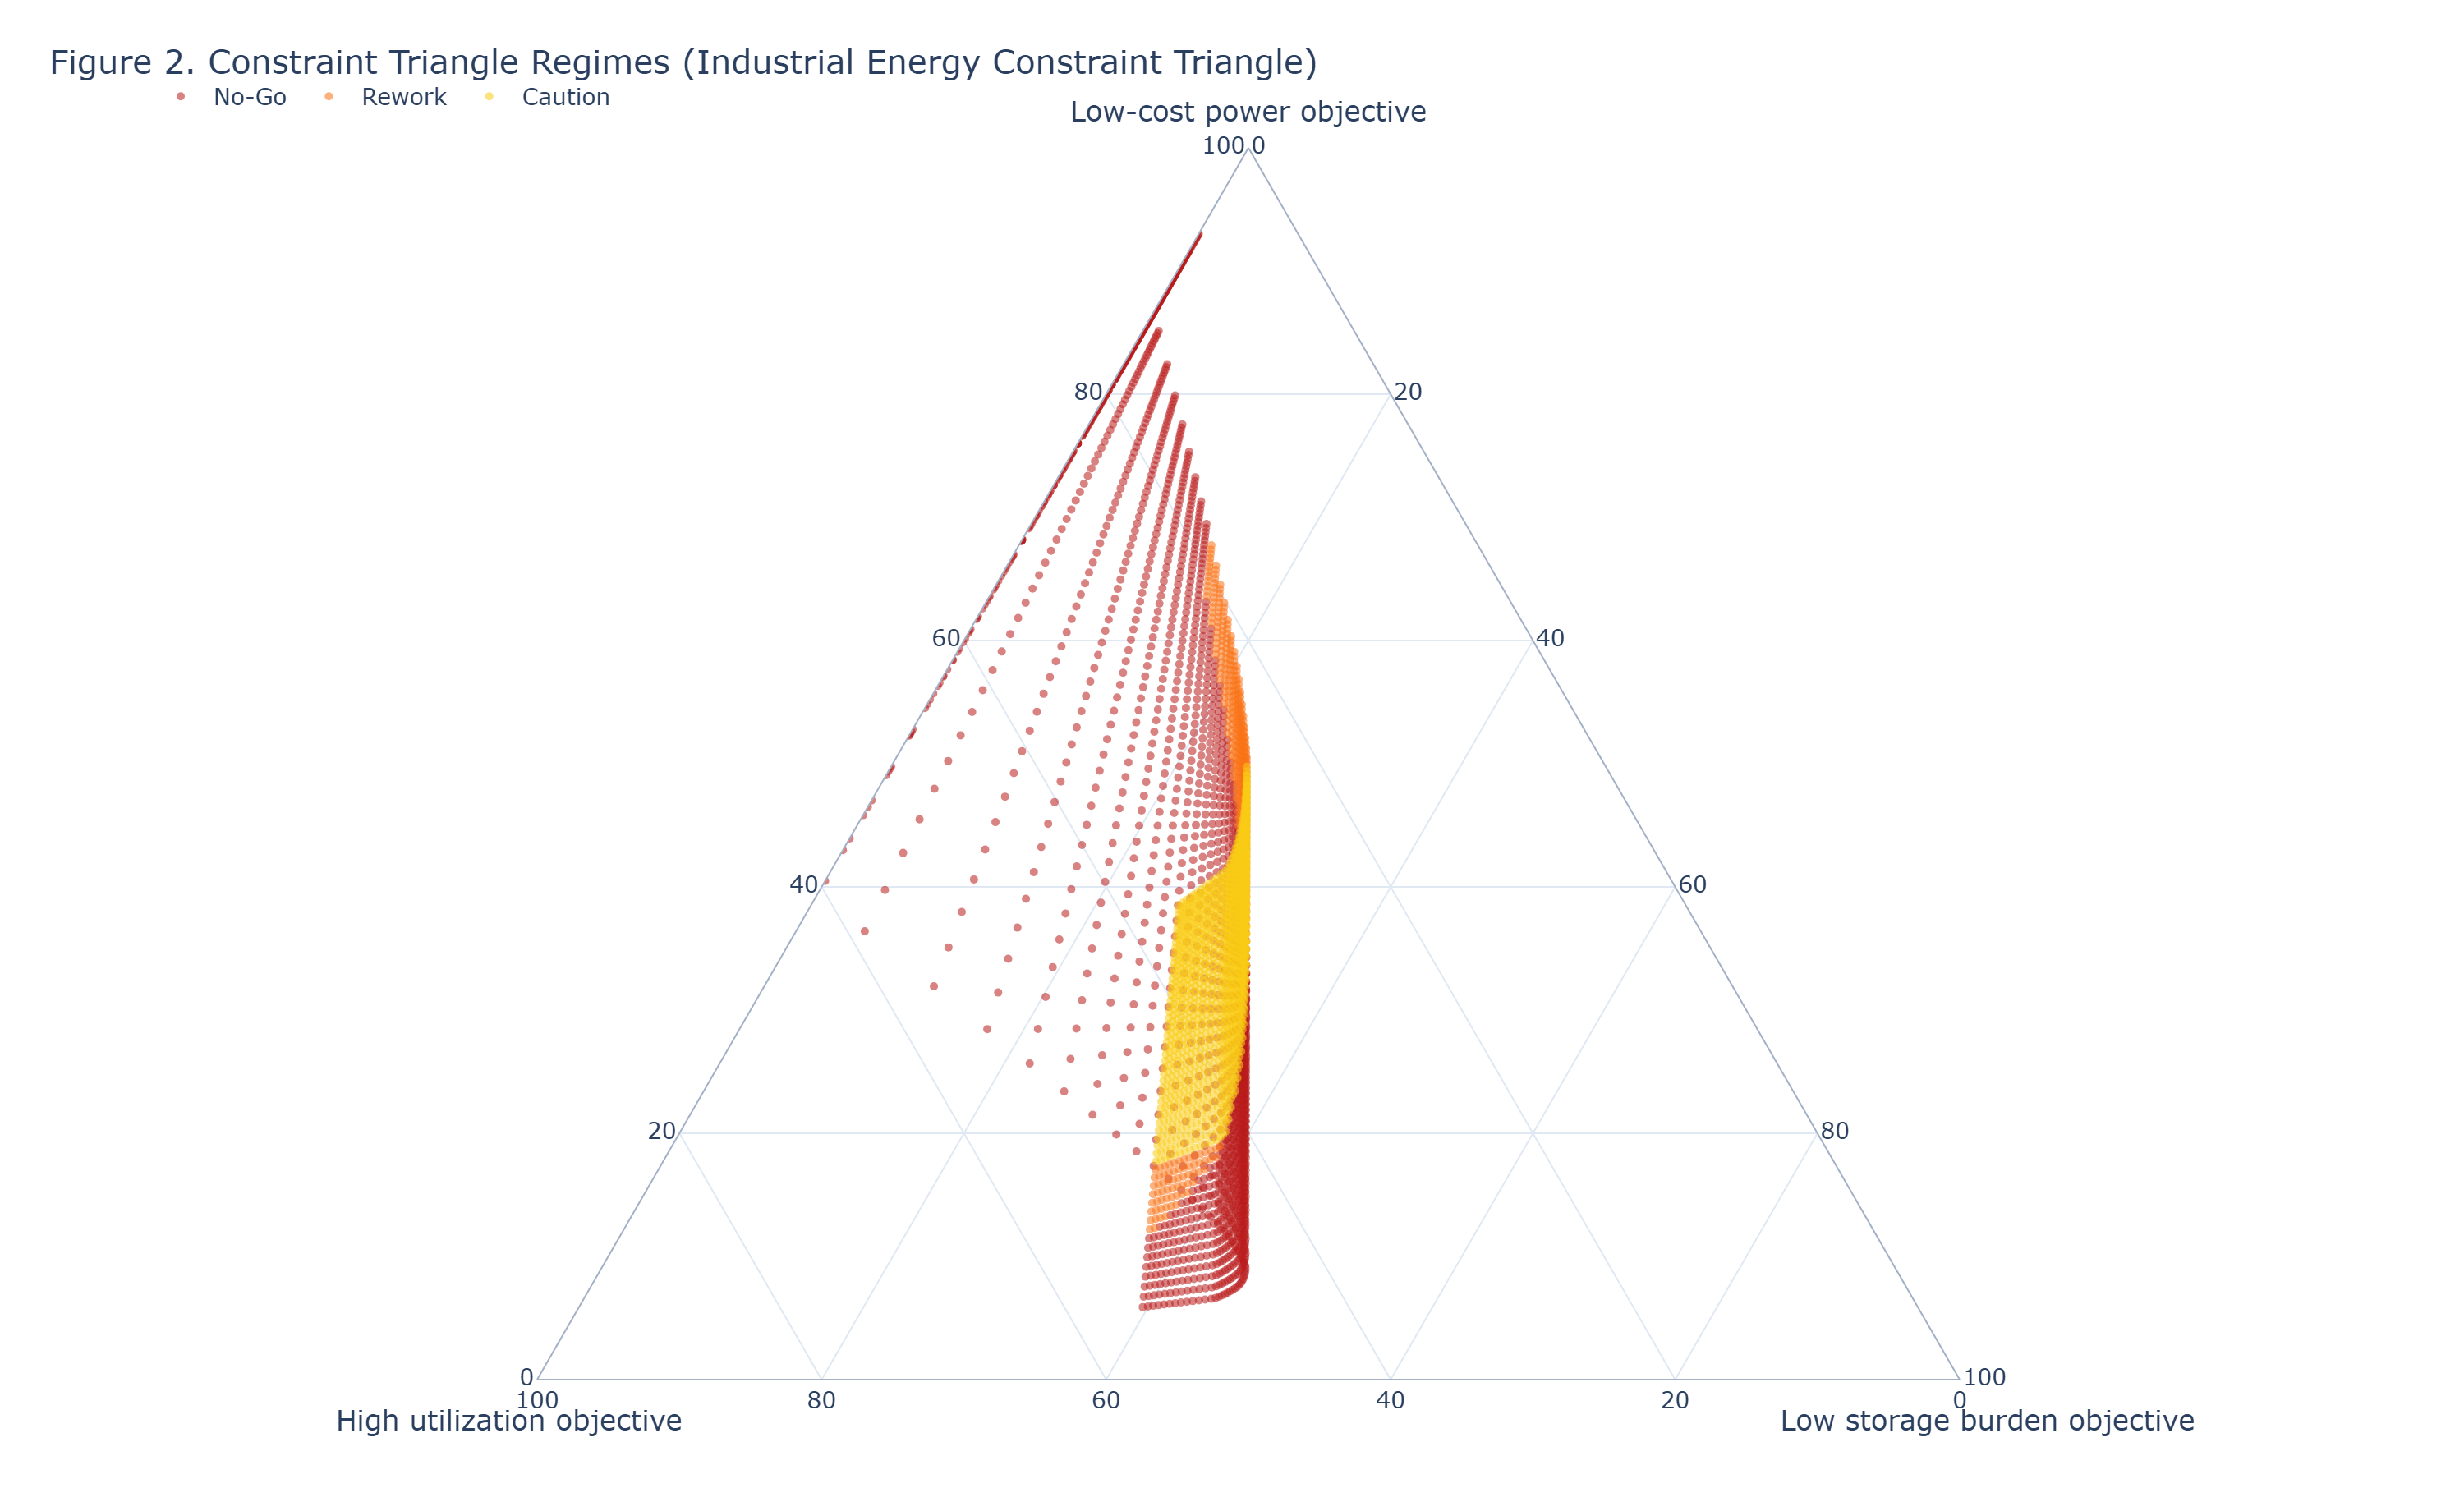
Decision statement
- Configurations that optimize one leg of the triangle force binding deterioration in at least one other leg.
Figure 3 - Decision Exposure Matrix
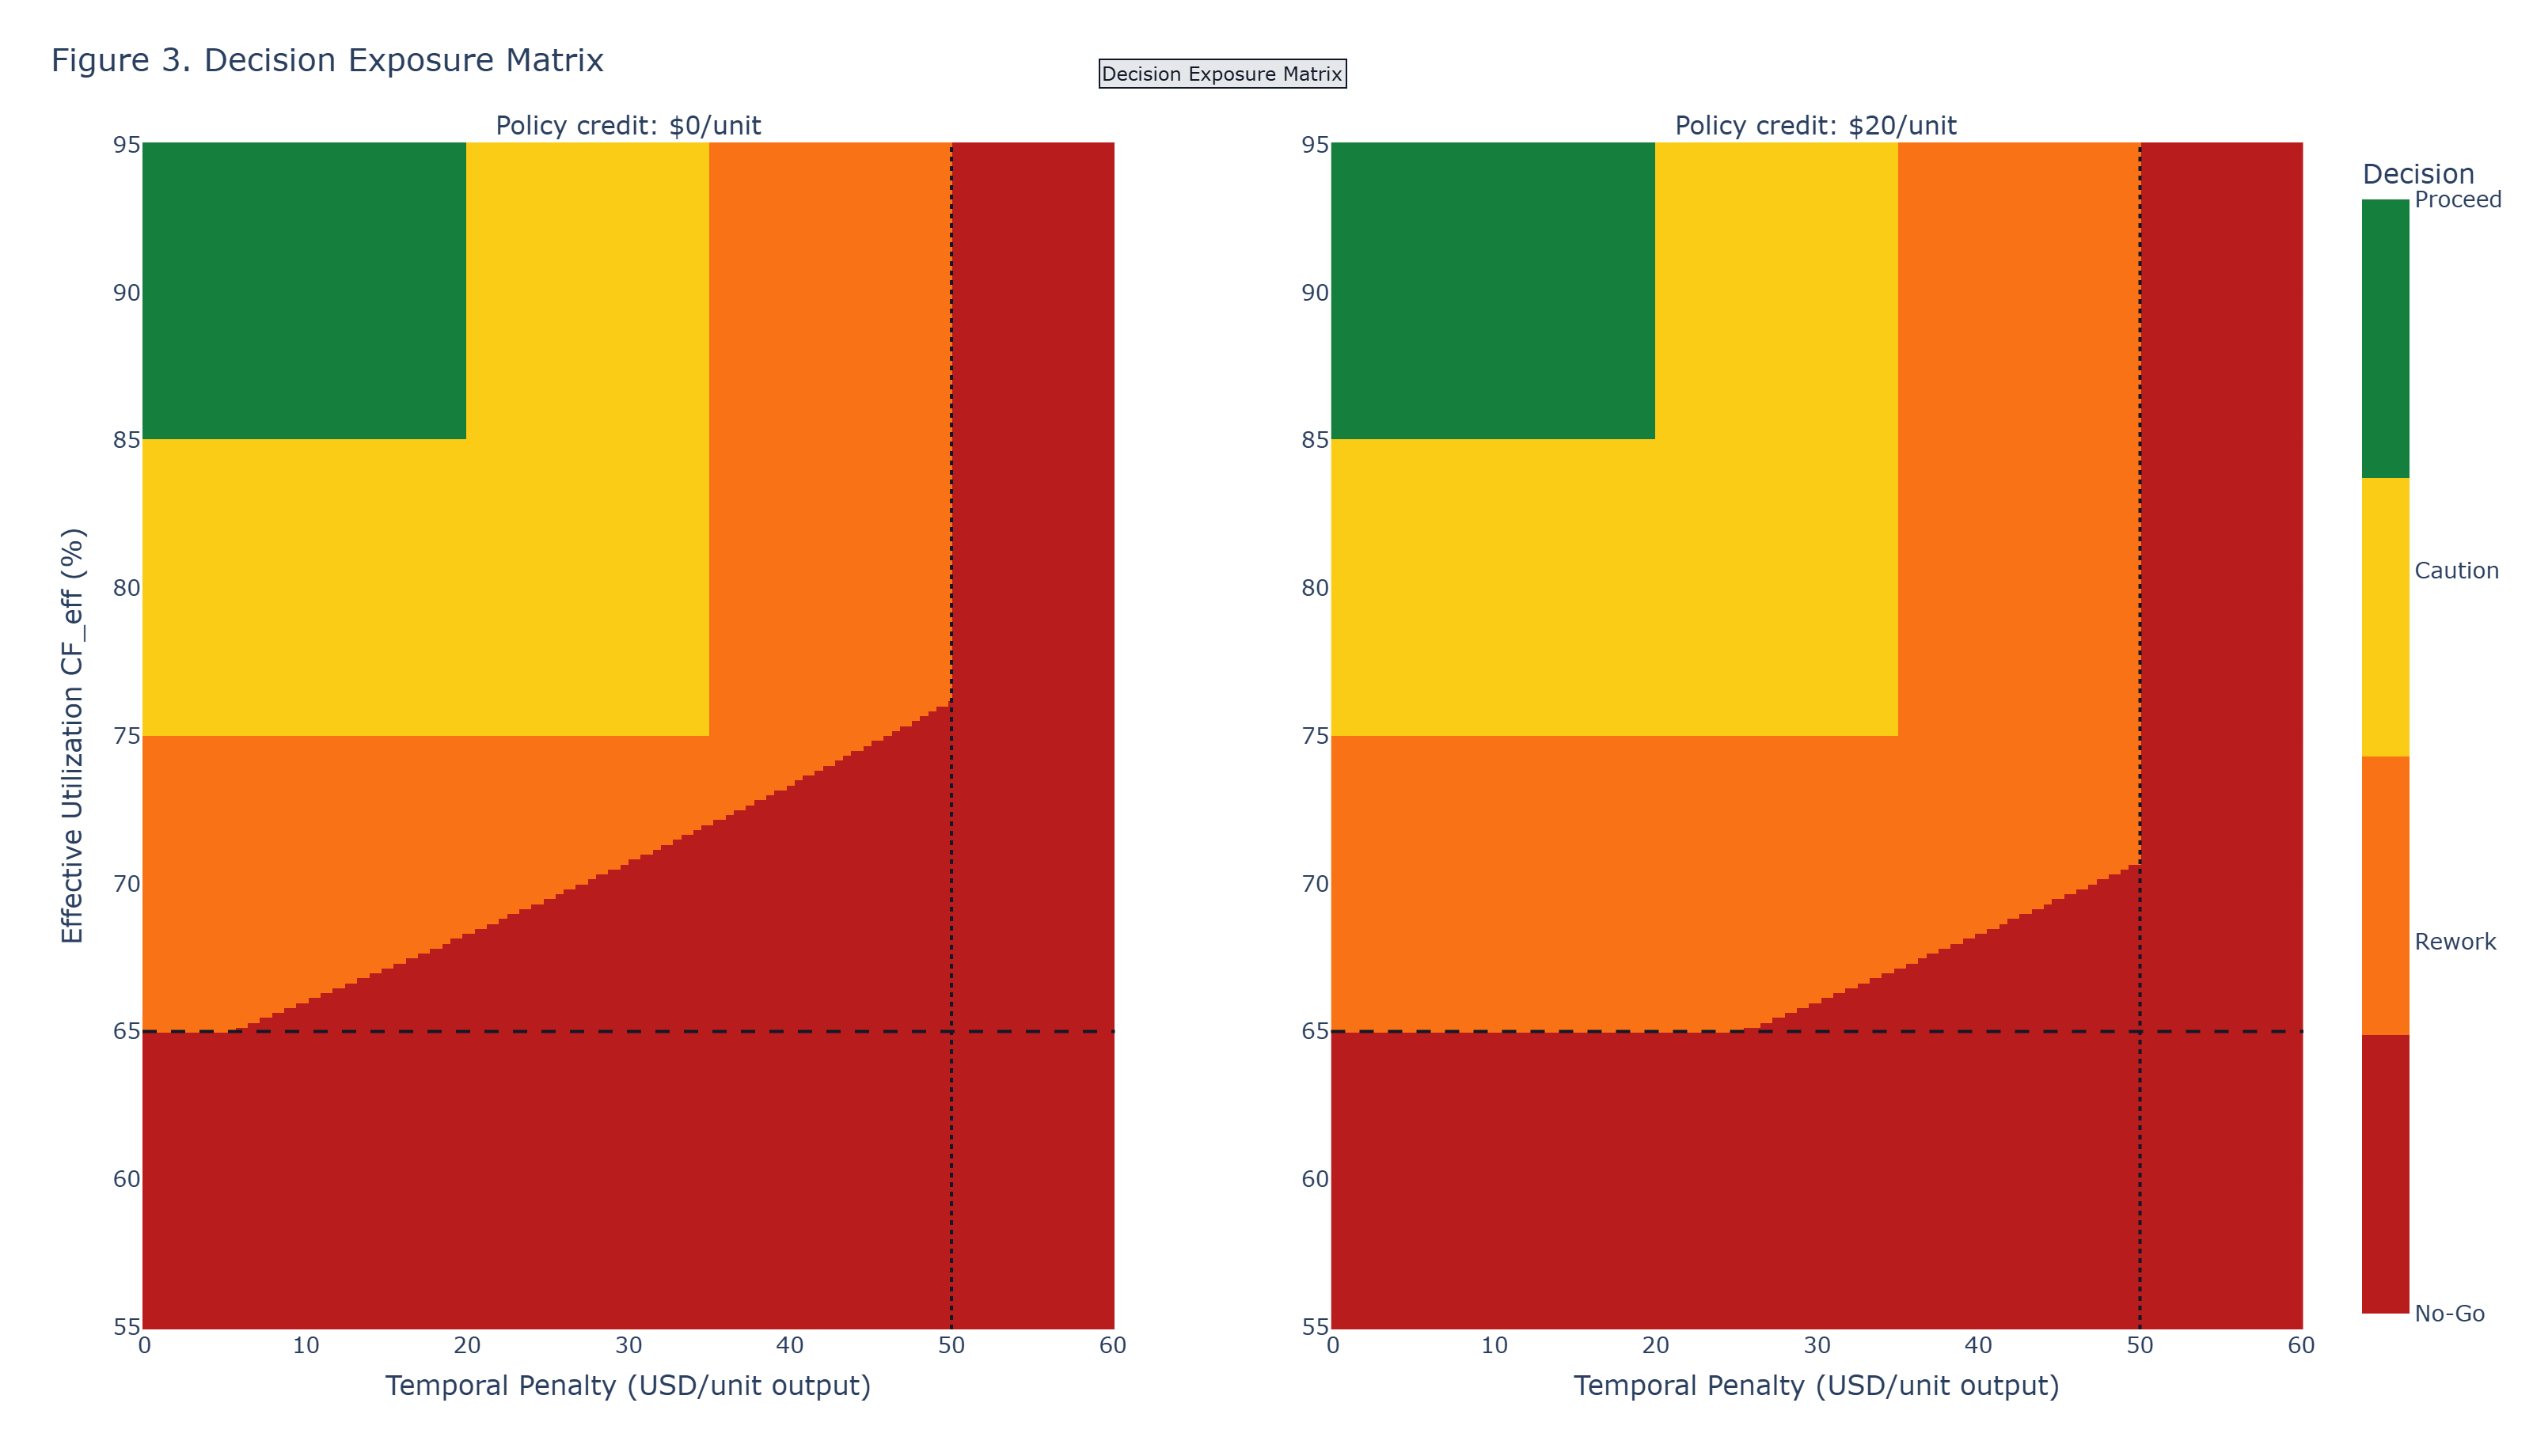
Decision statement
- Projects that enter Temporal Decoupling Failure Regime should not progress without structural redesign.
Figure 4 - Signature Utilization Viability Collapse Chart
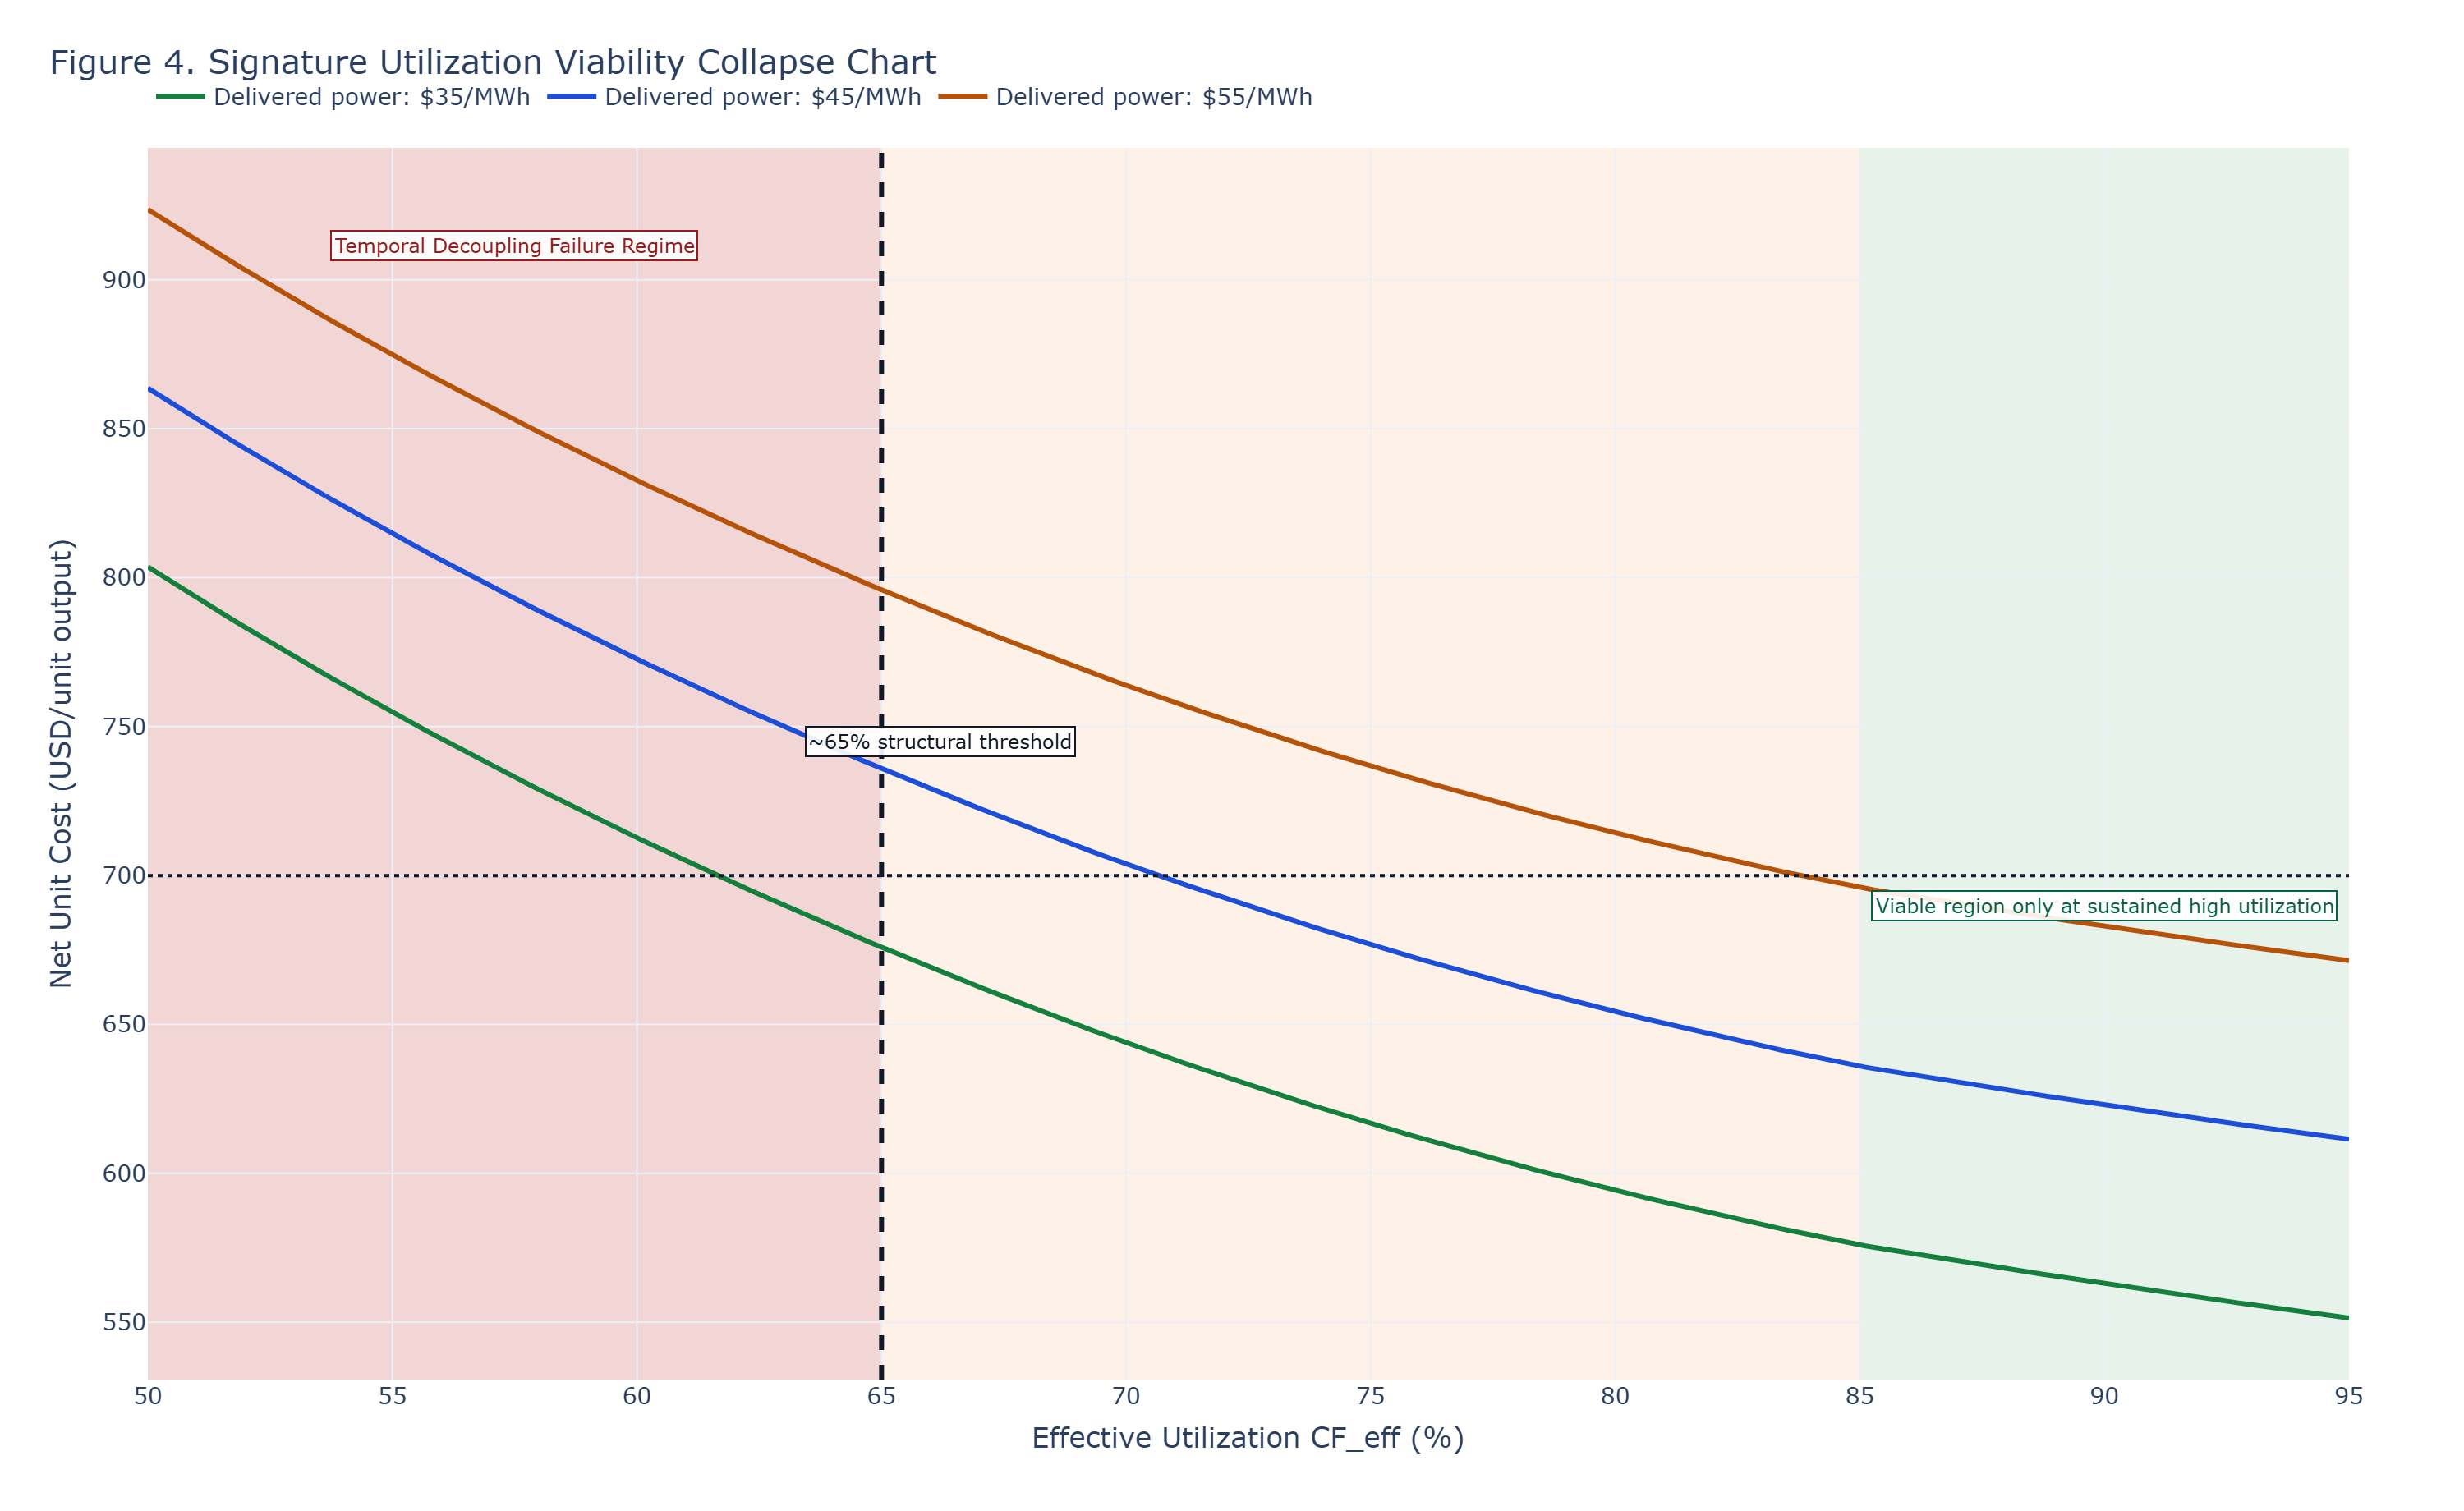
Decision statement
- This chart is the fast-screen visual: below
~65%effective utilization, cost recovery collapses across delivered-power cases. - Entry into Temporal Decoupling Failure Regime is a loss of economic recoverability, not a minor performance degradation.
Publication Completion Checklist
- ✓ Figure assets exported to
assets/img/notes/utilization-ceiling-intermittent-power-breaks-industrial-scale-economics/ - ✓ Source inputs populated in
assets/data/notes/utilization-ceiling-intermittent-power-breaks-industrial-scale-economics/ - ✓ Threshold values calibrated with source-validated evidence
- ✓ Decision matrix validated against stress-test scenarios
- ✓ Confidence tag updated from draft to calibrated status
Companion linkage
Observed Across Pathways
- Hydrogen: 45V parity fails when effective utilization weakens and temporal penalties remove margin.
- SAF: feedstock, hydrogen, and policy dependencies tighten simultaneously; viability collapses under realistic utilization and timing constraints.
- Ammonia: continuous synthesis demand forces temporal alignment requirements that drive rapid entry into Temporal Decoupling Failure Regime.
These are not independent failures. They are expressions of the same structural constraint. Intermittent power is not a cost advantage unless it sustains utilization above the structural threshold required by industrial systems.
Citation Readiness & Reproducibility
- Publication date & version: April 2026 | v1.0
- Canonical URL: https://insightquantix.com/insights/utilization-ceiling-intermittent-power-breaks-industrial-scale-economics/
- Inputs and thresholds: See linked artifacts in
assets/data/notes/utilization-ceiling-intermittent-power-breaks-industrial-scale-economics/. - Reproducibility note: Boundary behavior is most sensitive to effective utilization, delivered power cost, temporal-penalty stack behavior, and policy-credit realization assumptions.
- Disclosure: Insight Quantix derived all analytical conclusions independently; external references provide context only.
How to Cite This Analytical Note
APA Format
Gomez, J. R. (2026). The Utilization Ceiling: Why Intermittent Power Breaks Industrial Scale Economics (Insight Quantix Analytical Note IQ-AN-GEN-2026-01, v1.0). Retrieved from https://insightquantix.com/insights/utilization-ceiling-intermittent-power-breaks-industrial-scale-economics/
Chicago Format
Gomez, Jamie R. "The Utilization Ceiling: Why Intermittent Power Breaks Industrial Scale Economics." Insight Quantix Analytical Note IQ-AN-GEN-2026-01, v1.0, April 2026. https://insightquantix.com/insights/utilization-ceiling-intermittent-power-breaks-industrial-scale-economics/.
BibTeX
@techreport{Gomez2026_UtilizationCeiling,
  author = {Gomez, Jamie R.},
  title = {The Utilization Ceiling: Why Intermittent Power Breaks Industrial Scale Economics},
  institution = {Insight Quantix},
  year = {2026},
  type = {Analytical Note},
  number = {IQ-AN-GEN-2026-01},
  month = apr,
  url = {https://insightquantix.com/insights/utilization-ceiling-intermittent-power-breaks-industrial-scale-economics/}
}Appendix A: Modeling Parameters
- Model form: See governing equations and threshold definitions in the technical section of this note.
- Primary data artifacts:
assets/data/notes/utilization-ceiling-intermittent-power-breaks-industrial-scale-economics/ - Primary figure artifacts:
assets/img/notes/utilization-ceiling-intermittent-power-breaks-industrial-scale-economics/ - Reproducibility scope: This appendix anchors file locations and parameter traceability for decision-grade review.
About the Author
About Insight Quantix
Insight Quantix publishes independent analytical work for transparency and decision clarity. The analysis examines benchmark-anchored, audit-defensible economic risk conditions relevant to capital allocation decisions in the $10M-$500M range.
Validation Methodology: ASTM E3200 | ISO 14040/14044 | NREL benchmark-anchored Engine Documentation: Available upon request Website: insightquantix.com
This analytical note is provided for informational and educational purposes only and does not constitute investment advice, financial advice, engineering design recommendations, or legal interpretation of tax policy. Readers should conduct independent due diligence and consult qualified professionals before making capital allocation decisions. The analysis reflects representative scenarios based on stated modeling parameters and should not be construed as a guarantee of project performance or economic outcomes. Specific project economics require site-specific analysis accounting for local conditions, technology configurations, and regulatory environments. Insight Quantix makes no warranties, express or implied, regarding the accuracy, completeness, or reliability of this information for any particular purpose.
© 2026 Insight Quantix. This analytical note may be cited with proper attribution.